
One of the hottest things in Excel in data analysis right now is Power Query.
While Power Query has been around for more than 10 years now, it’s only recently that it has started getting its due.
If you are new to Power Query, or you want to learn some advanced concepts (such as M code language), you have come to the right place.
In this article, I will give you a brief overview of what Power Query is and why it’s an absolutely must-have skill for you. I will also link to many of the Power Query related articles that you will find useful in your quest to master Power Query.
So, let’s get into it!
PS: I have a Free Power Query course that covers almost everything you need to know about power cleaning and sets you up for advanced learning. Check it out!
What is Power Query?
Power Query is a tool available within Excel and Power BI that allows you to connect to many different data sources and fetch the data into Power Query.
Once you have the data in Power Query Editor, you can perform a lot of data transformation and cleaning (such as filtering rows, removing duplicates, merging tables, etc.).
Once you have transformed/cleaned the data and have it in the desired format, you can you can load this data into various places such as a data model, a worksheet in Excel or as a connection (which can be used by other queries)
Power Query started as an add-in for Excel 2010 and Excel 2013, and from Excel 2016 onwards, it became a part of the Excel ribbon as Get & Transform in the Data tab. Apart from Excel and Power BI, Power Query is also available in other Microsoft tools such as Power Platform Dataflows, Fabric, etc.
How to Get Power Query in Excel?
Power Query is now available in Excel in Windows, Mac and Web.
Power Query in Excel For Windows
If you’re using Microsoft 365, Excel 2021, Excel 2019, or Excel 2016, you already have it.
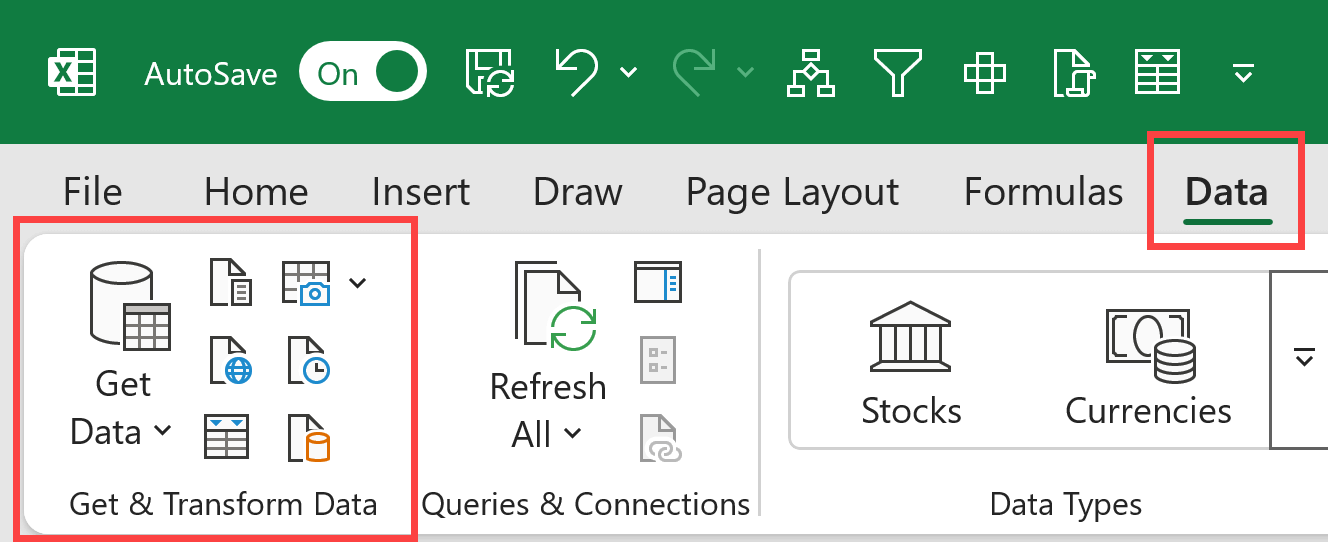
It’s already built in into the product and you can access it by going to the Data tab where you will see a Get and Transform group.
And if you are using Excel 2010 or Excel 2013, then you can get Power Query by installing the add-in as shown in the video below.
Power Query in Excel For Mac
For Mac users, Power Query was released a bit later and is only available if you are using Excel with Microsoft 365 on a Mac.
Power Query in Excel on the Web
Power query is available for everyone in Excel on the web. And new features are continuously added to it.
Since there are so many different versions of Power Query in different environments such as Windows and Mac and Web, you may find that some of the new features are first released on one platform and then added to other platforms later. For example, Power Query usually gets new features in Power BI first and then they are rolled out to Excel a bit later.
Awesome Things You Can Do With Power Query
Power Query is a data connectivity and transformation tool that simplifies how you work with data from multiple sources.
With Power Query you can connect to a lot of different data sources, get the data from these data sources into Power Query Editor, then make a lot of useful transformations so that you can clean your data and remove unnecessary things.
And once done, you can load it into different places such as an Excel worksheet or a data model.
Extract – Connect to Various Data Sources
The first step in working with data is often bringing it together from multiple locations.
Power Query Excels at this (pun intended).
It allows you to connect to and retrieve data from an extensive range of sources.
Think of it as a versatile connector for accessing information, whether it’s in Excel files, databases, cloud services, or web pages.
Microsoft keeps adding new connectors to an already long list of Power Query connectors. And it also allows users to create their own connection in case one is not available.
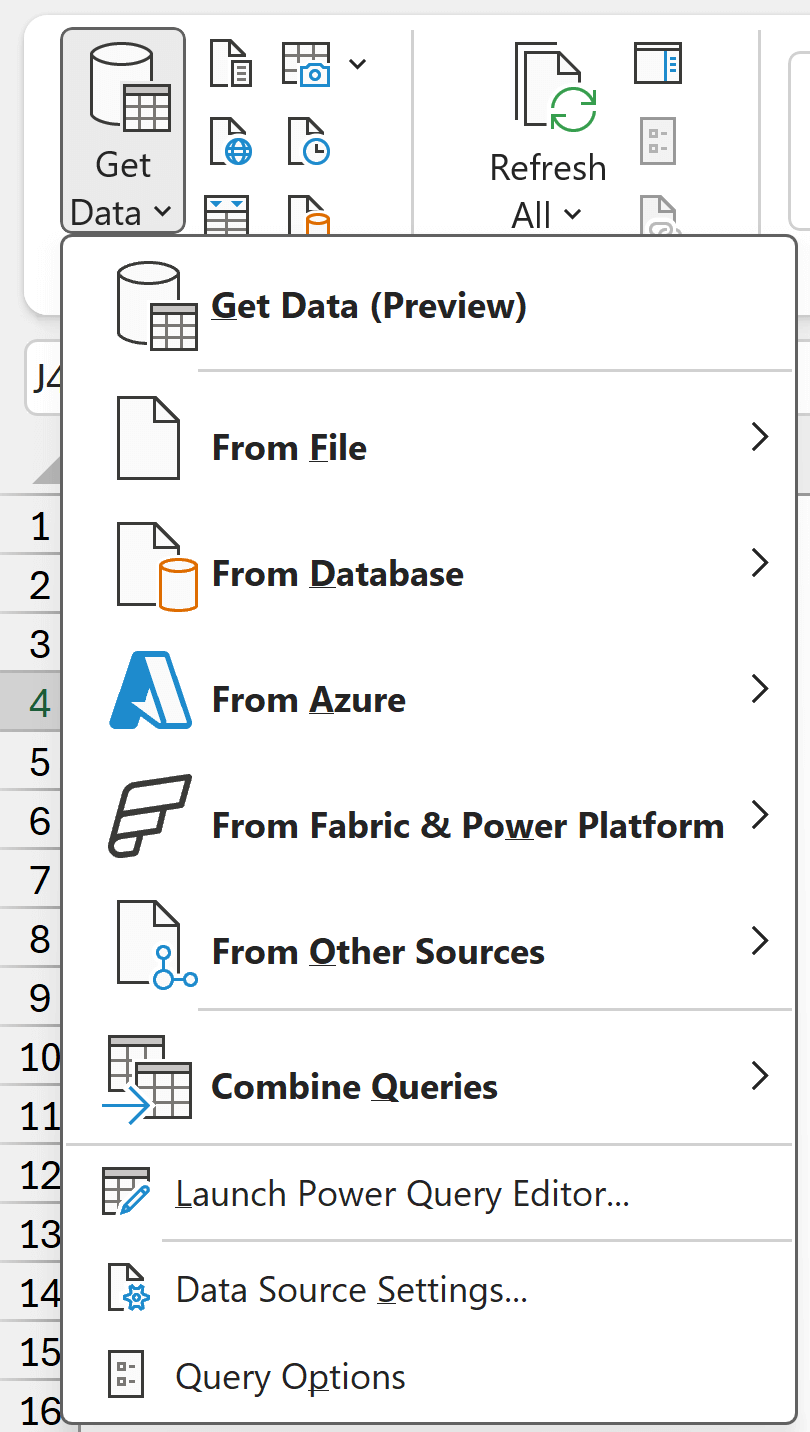
To see all the data connectors available to you in Power Query, you can go to the Data tab in the ribbon and then click on the Get Data option. It will show you a drop down along with all the data connection options.
Transform – Transform Large Data Easily
Once you’ve successfully pulled your data into Power Query, the next crucial step is to make sure that data is clean and ready for analysis.
Now, it’s quite rare (really rare) that you would get data in a perfect, ready-to-use form straight away.
More often than not, you’ll find it needs some tidying up. Sometimes the data might be right but it’s not structured in a way that you want.
This is exactly where Power Query really shines.
Once you have the data in Power Query Editor, you clean it up and get it in the format you want.
With a few simple clicks you can filter out unnecessary rows, sort data in your preferred order, correct errors, and add new calculated columns.
Load – Places to Load Transformed Data
After you’ve connected to your data sources and transformed your data to perfection, the final step is deciding where to put this cleaned data.
Power Query gives you several flexible options for loading your transformed data, and the choice depends on what you plan to do with it next.
Main Loading Options
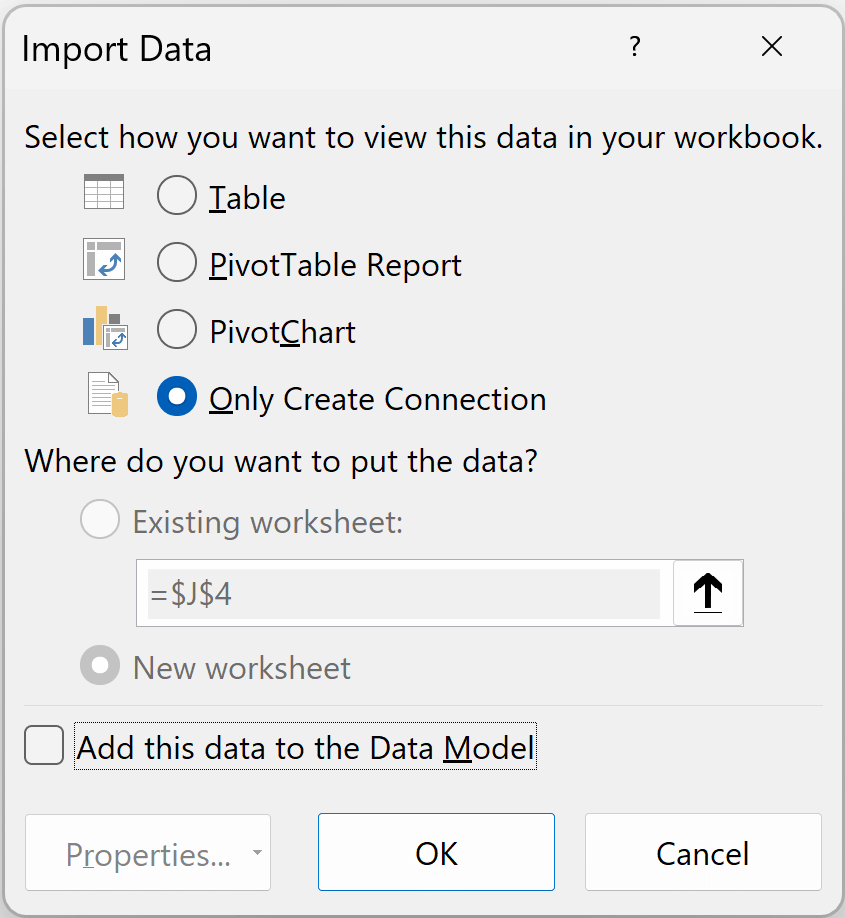
Load as Table – The most straightforward option is to load your data directly into an Excel worksheet as a table. You can choose to get the table in the existing worksheet or in a new worksheet. This creates a nicely formatted table that you can sort, filter, and analyze using Excel’s familiar interface. The table stays connected to your Power Query, so you can refresh it anytime to update the data.
Load as PivotTable Report – This option immediately creates a Pivot Table from your Power Query data. It’s perfect when you know you want to analyze and summarize your data right away. The Pivot Table will be connected to your query, allowing for easy refreshes.
Load as PivotChart – Similar to the PivotTable option, this creates a PivotChart directly from your Power Query data. Choose this when you want to visualize your data immediately after loading.
Only Create Connection – This option creates the connection and stores all your transformation steps without actually loading the data anywhere visible. It’s particularly useful when you’re building complex data models where one query feeds into another, or when you want to use this query as a building block for other queries.
Additional Option: Load to Data Model
Add this data to the Data Model is a checkbox that can be combined with any of the above loading methods.
When checked:
- Your data gets stored in Excel’s built-in database (the Data Model)
- You can handle much larger datasets than regular worksheets
- You gain access to Power Pivot and DAX formulas for advanced analysis
- The data becomes available for creating relationships with other tables
So you might load as a “Table + Data Model” or “PivotTable + Data Model” – the Data Model is an enhancement to your chosen loading method, not a standalone destination.
If you do not want to get the data anywhere such as a table or or Pivot Table, you can choose the option Only Create Connection and then check the Data Model option. So your queries remain in a connection only state and the data is available in the data model as well.
Refreshing Your Data (This is where magic happens)
Here’s where Power Query truly shows its magic – and why so many people fall in love with it once they understand this concept.
All your connections and transformations are saved as a set of steps. This means you set up your data cleaning process once, and then you can essentially forget about it.
When your source data changes (which usually does), you don’t need to manually repeat all those tedious cleaning and transformation steps. Instead, you simply refresh your query and Power Query automatically applies every transformation to the new data.
It’s like having a tireless assistant that remembers exactly how you like your data prepared and does it the same way every time.
For example, you can connect Power Query to a folder that fetches all the Excel files from that folder, combine them, clean the data and load it as an Excel table in your worksheet.
Now next time you get new data for next month or next quarter, you can just remove the older files, add the new files to the same folder and refresh the query and bam you’re done.
Understanding the Power Query Editor
I think I’ve already hyped up Power Query enough. So let’s get into the nuts and bolts and see what Power Query Editor looks like.
When you first open Power Query Editor, it might look a bit overwhelming with all the different sections and options. But don’t worry – once you understand what each area does, you’ll find it’s actually quite intuitive.
Let me walk you through the different parts of the Power Query Editor interface so you know exactly where everything is and what it does.
The Ribbon – Your Transformation Toolkit
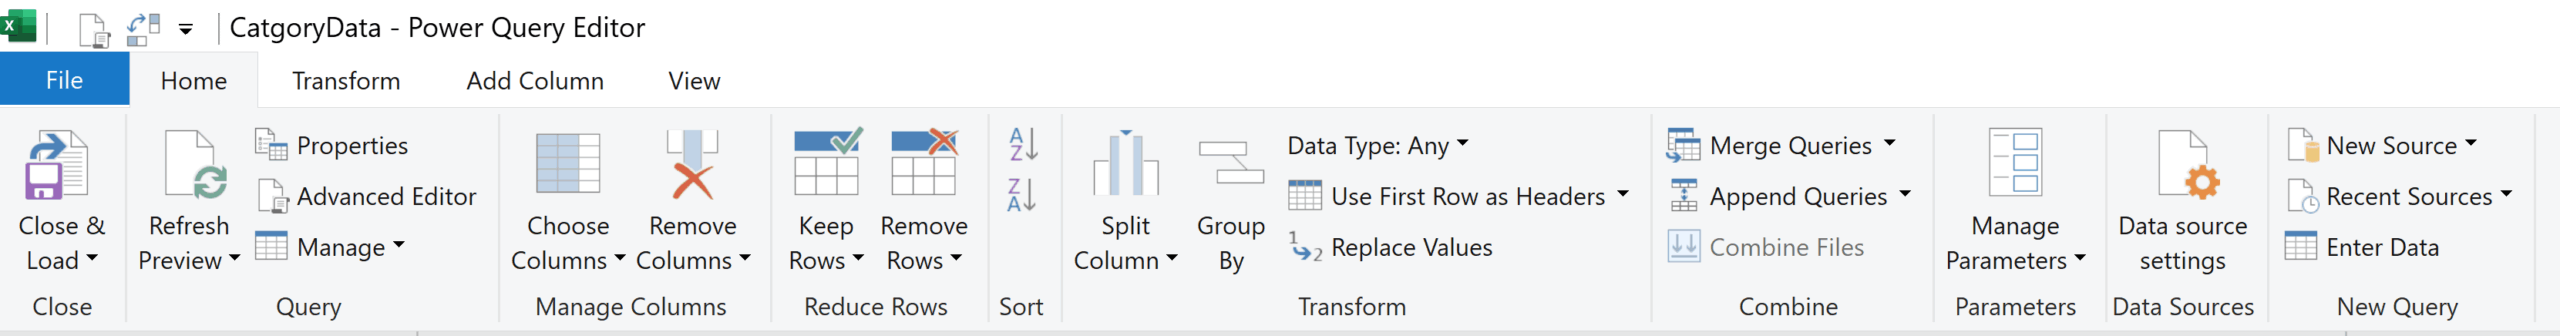
At the top of the Power Query Editor, you’ll see the ribbon with several tabs: File, Home, Transform, Add Column, and View.
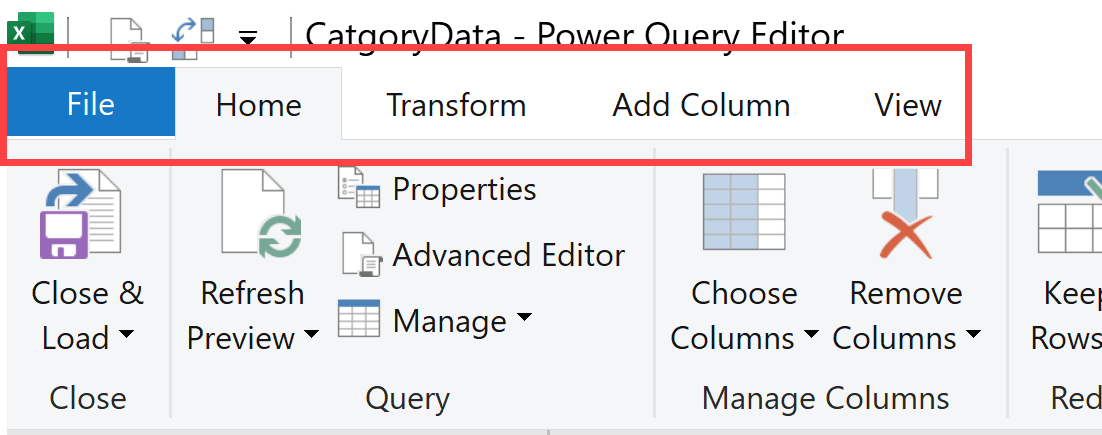
The Home tab contains the most commonly used functions like closing and loading your query, refreshing data, and basic operations like removing rows, choosing columns and sorting/filtering data. There also some query options such as Merge Queries and Append Queries.
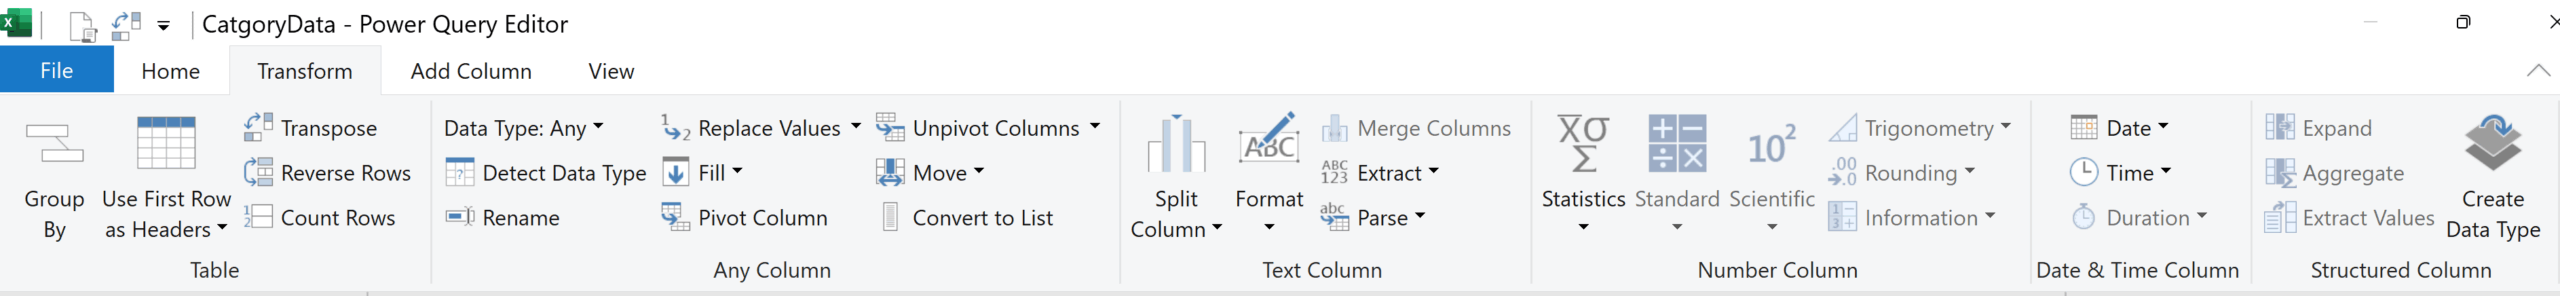
The Transform tab is where the real magic happens for data cleaning. Here you’ll find options to split columns, change data types, replace values, and perform various text and number transformations.
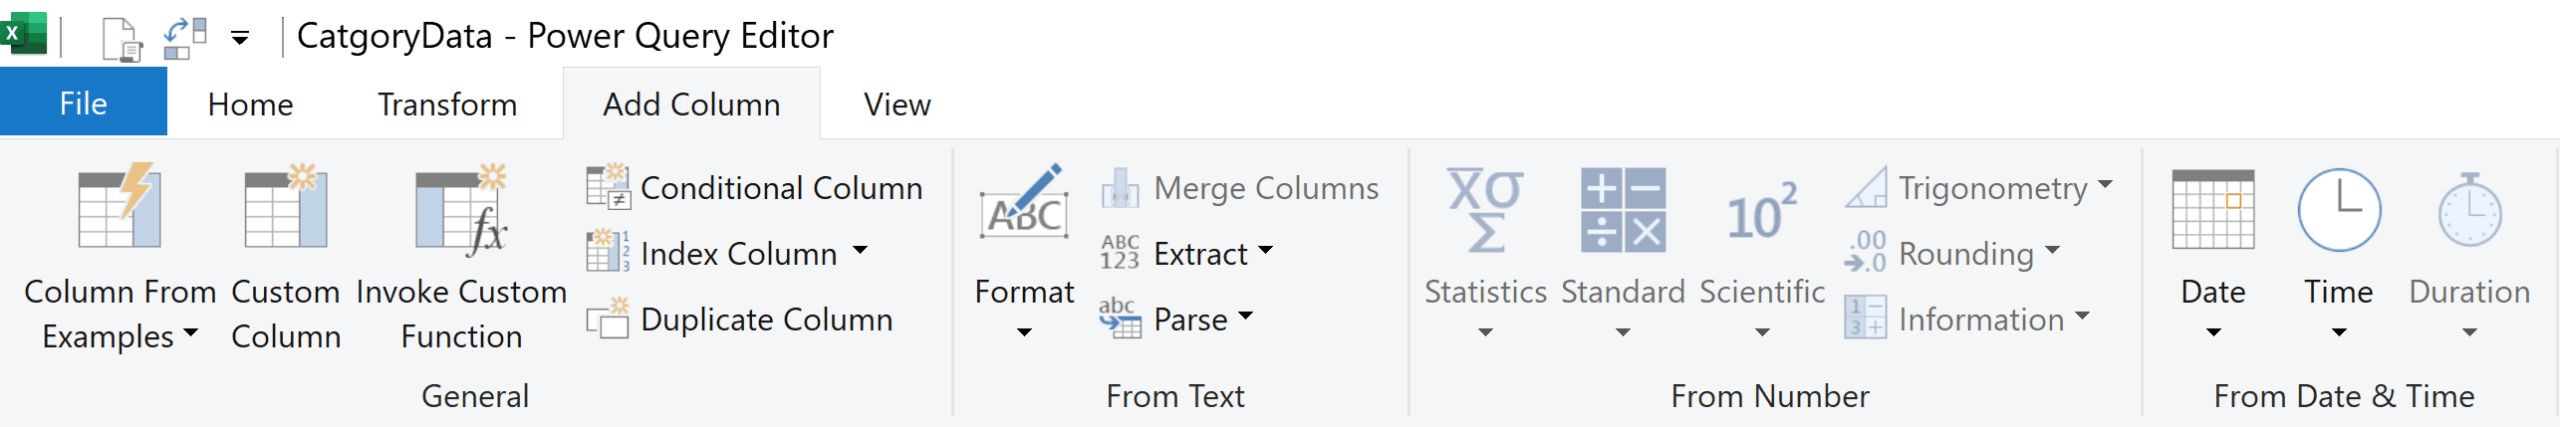
The Add Column tab lets you create new columns based on existing data. You can add custom columns with your own formulas, extract parts of dates, or perform calculations.
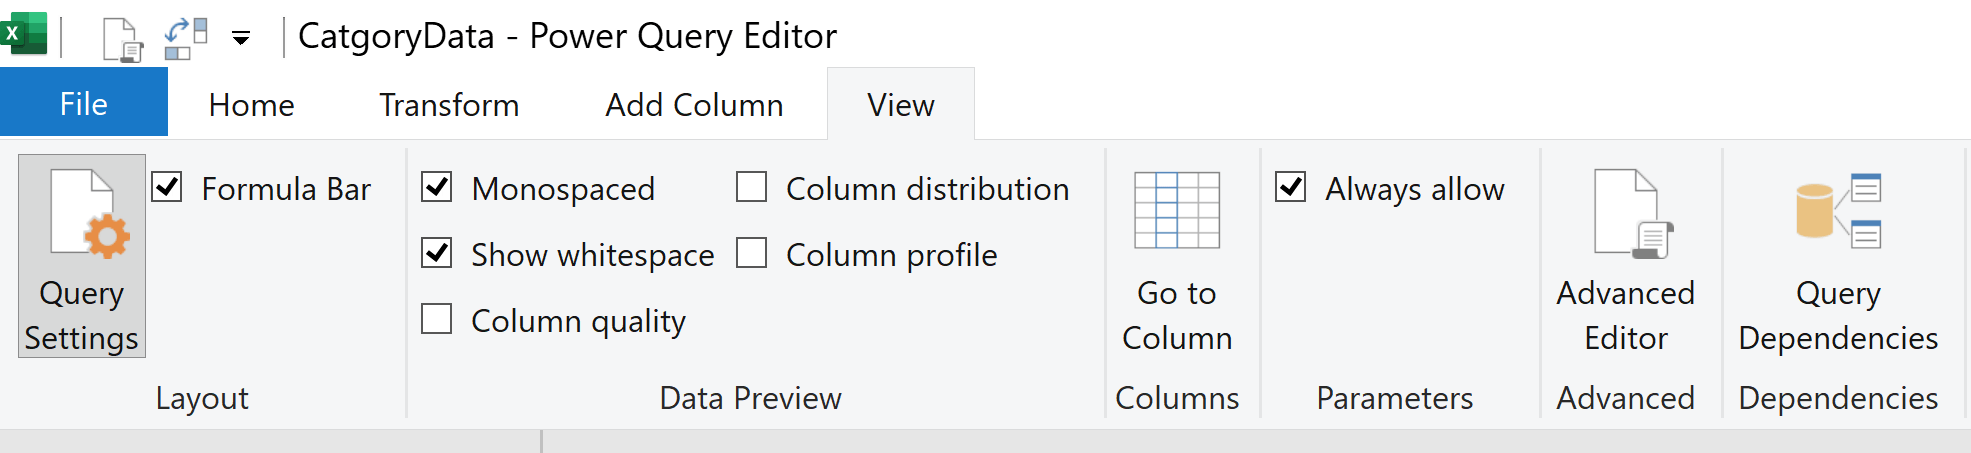
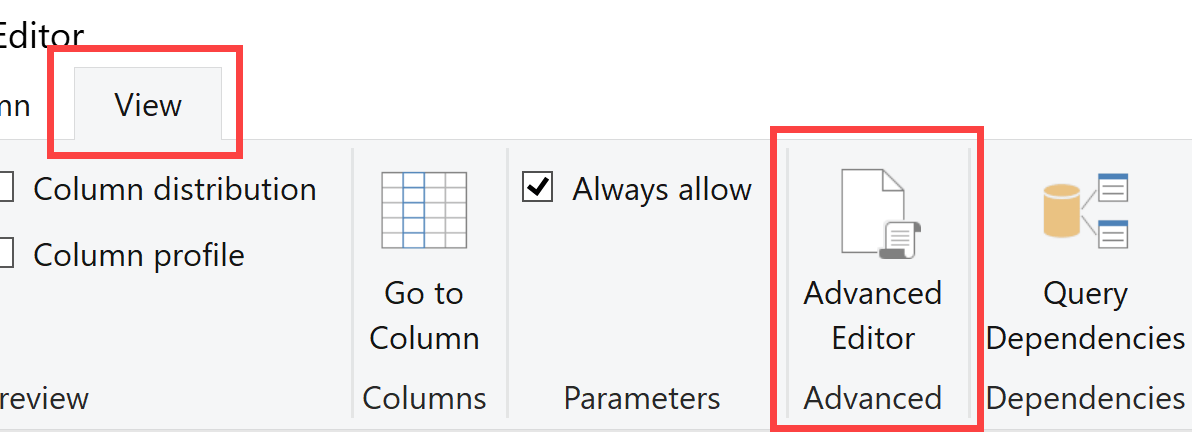
The View tab helps you customize how you see your data and access advanced features like the Advanced Editor (more on this in a moment).
The Queries Panel – Your Query Library
On the left side of the screen, you’ll see the Queries panel. This is like your query library where all your queries are listed.
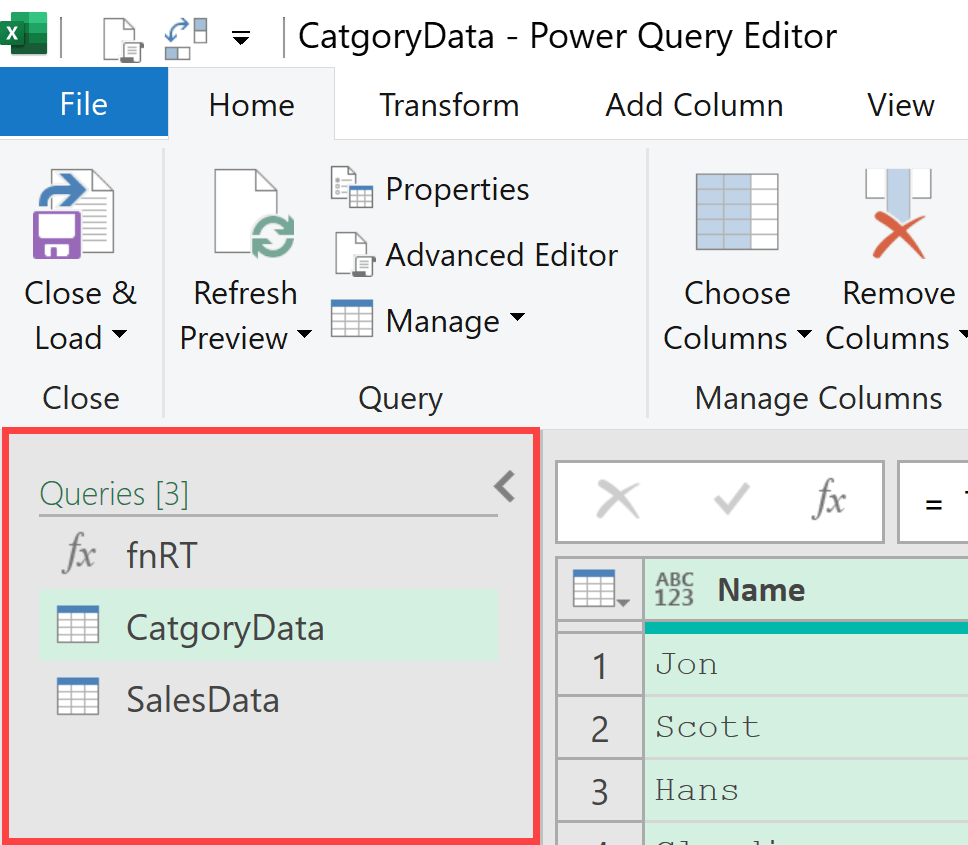
You might have multiple queries in a single Power Query session – perhaps one that connects to your sales data, another that gets category information, and a third that combines them both.
Each query appears as a separate item in this panel, and you can click on any query name to switch between them and see their data and transformation steps.
The Data Preview Area – Your Data Workspace
The large central area is where you’ll see a preview of your data. This isn’t just a static view – it’s interactive.
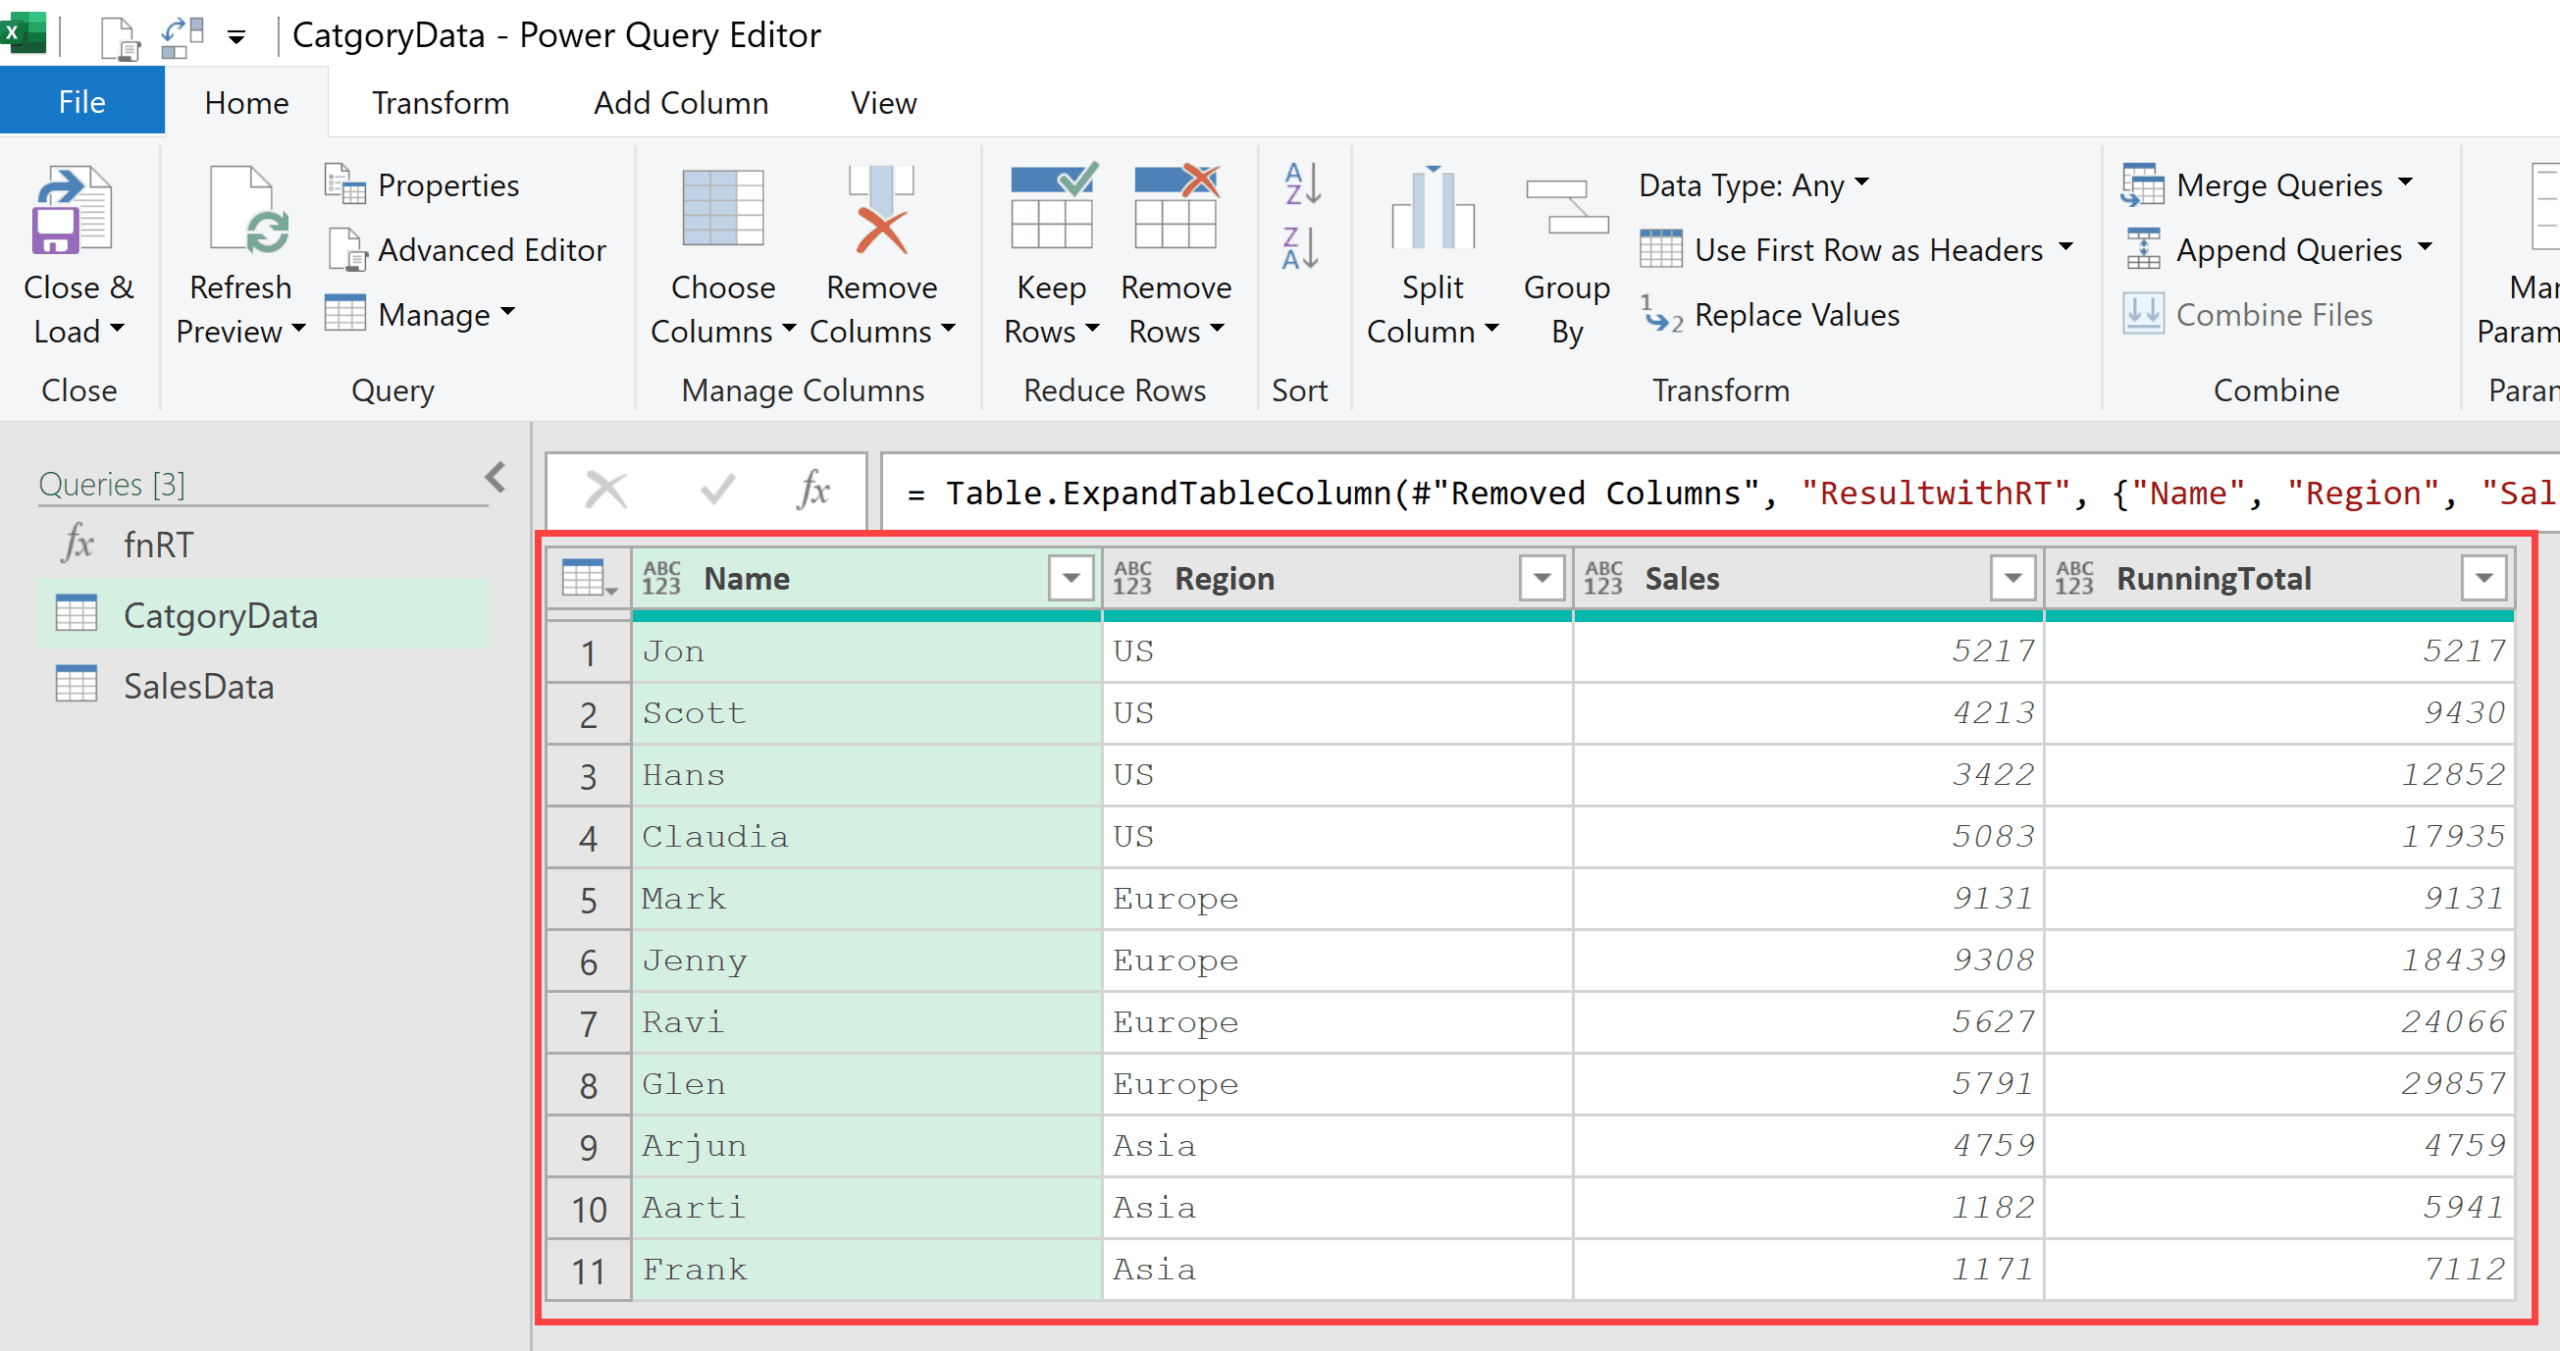
You can click on column headers to select entire columns, right-click to get context-specific options, and see how your data looks after each transformation step.
The data preview shows you a sample of your data (the first 1000 rows), which is perfect for seeing the effects of your transformations without having to process massive datasets.
Query Settings Panel – Your Step-by-Step Recipe
On the right side, you’ll find the Query Settings panel, which has two crucial sections:
- Properties shows basic information about your current query, like its name (which you can change by simply typing a new name).
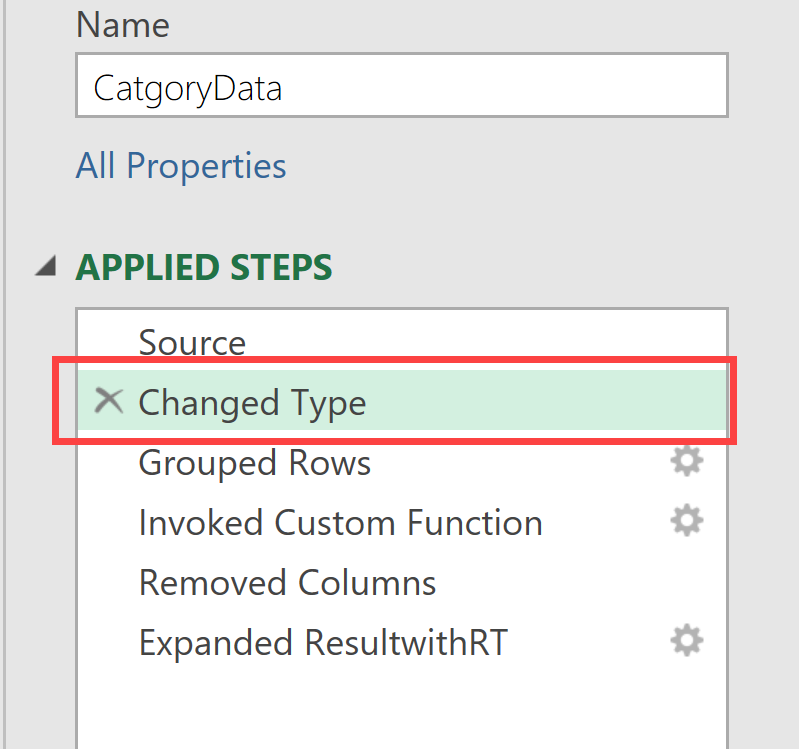
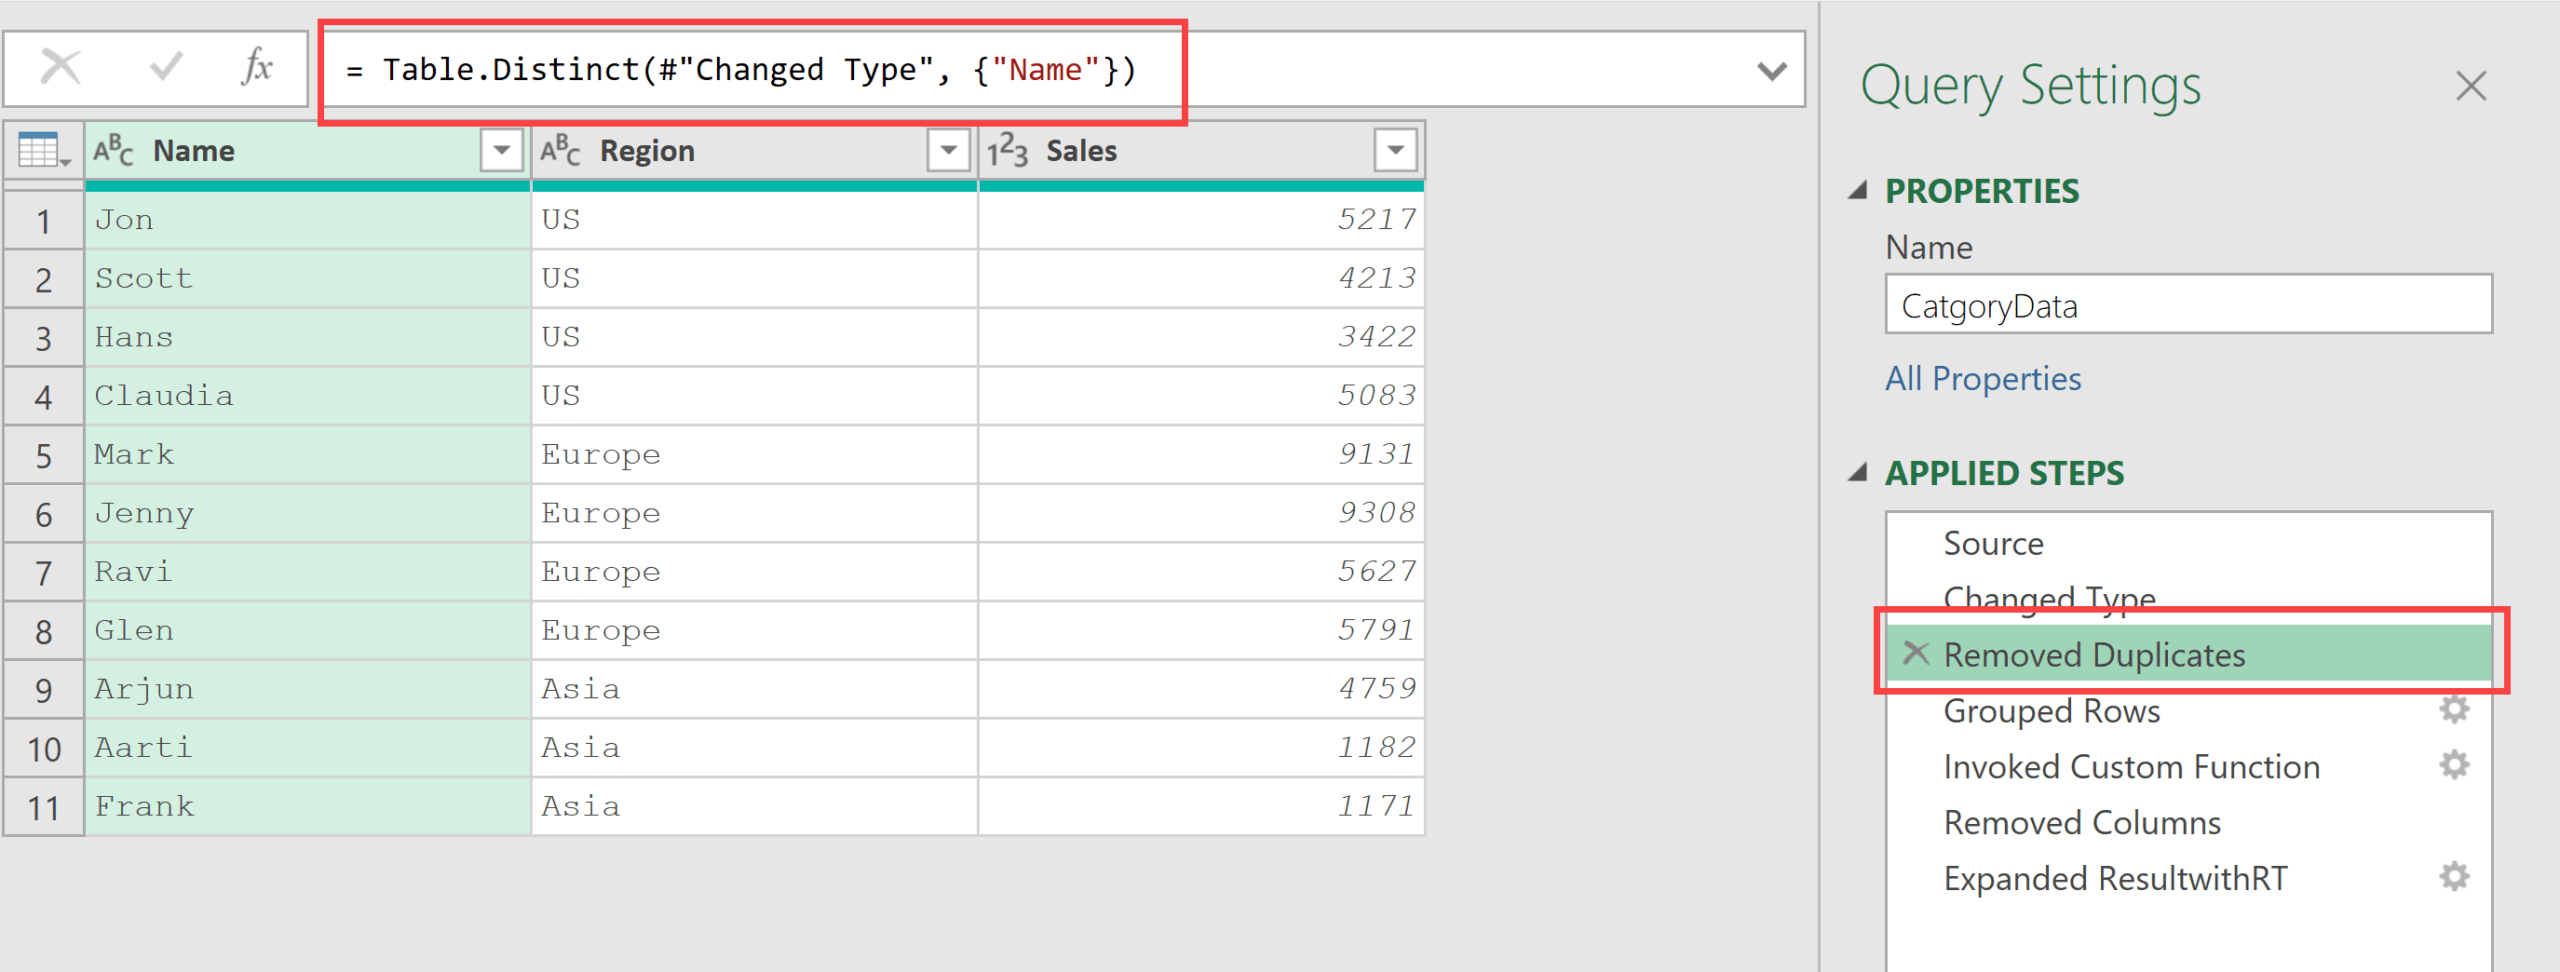
- Applied Steps is perhaps the most important section in the entire Power Query Editor. This is where every single transformation you make gets recorded as a step.
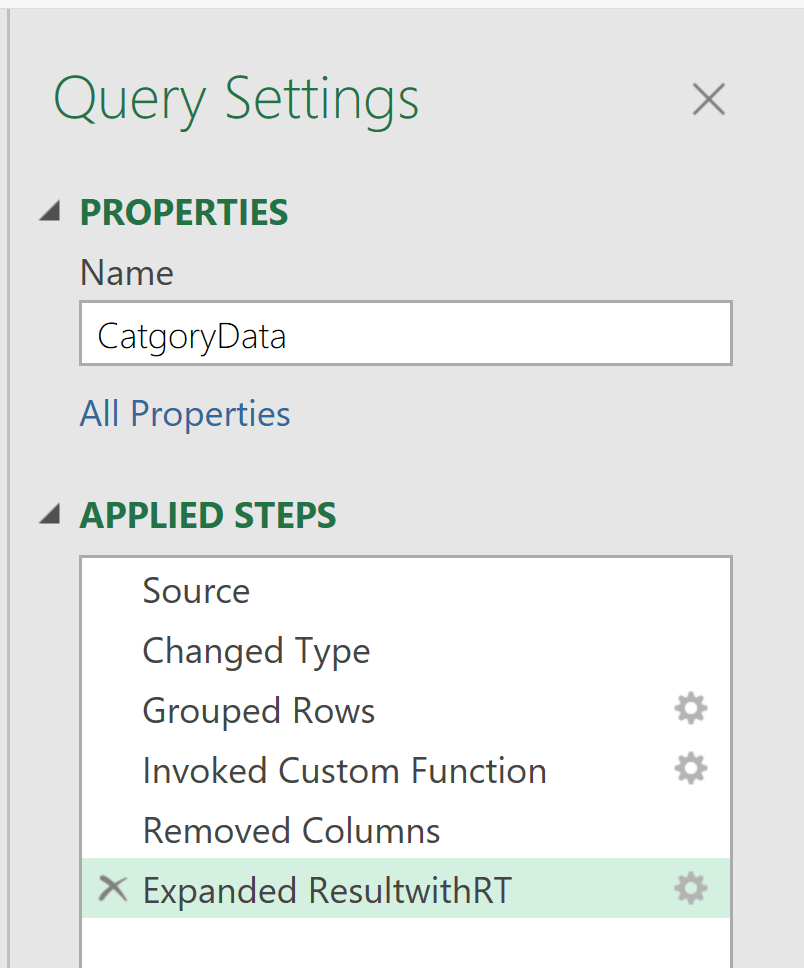
Each step has a name (like “Source”, “Changed Type”, “Filtered Rows”) and you can click on any step to see what your data looked like at that point in the process.
The beautiful thing about these steps is that they’re completely editable. You can delete steps, modify them, or even rearrange their order. If you realize you made a mistake three steps ago, you don’t have to start over – just click on that step and fix it.
Formula Bar – See What’s Happening
Just above the data preview area, you’ll notice a formula bar (similar to Excel’s formula bar).
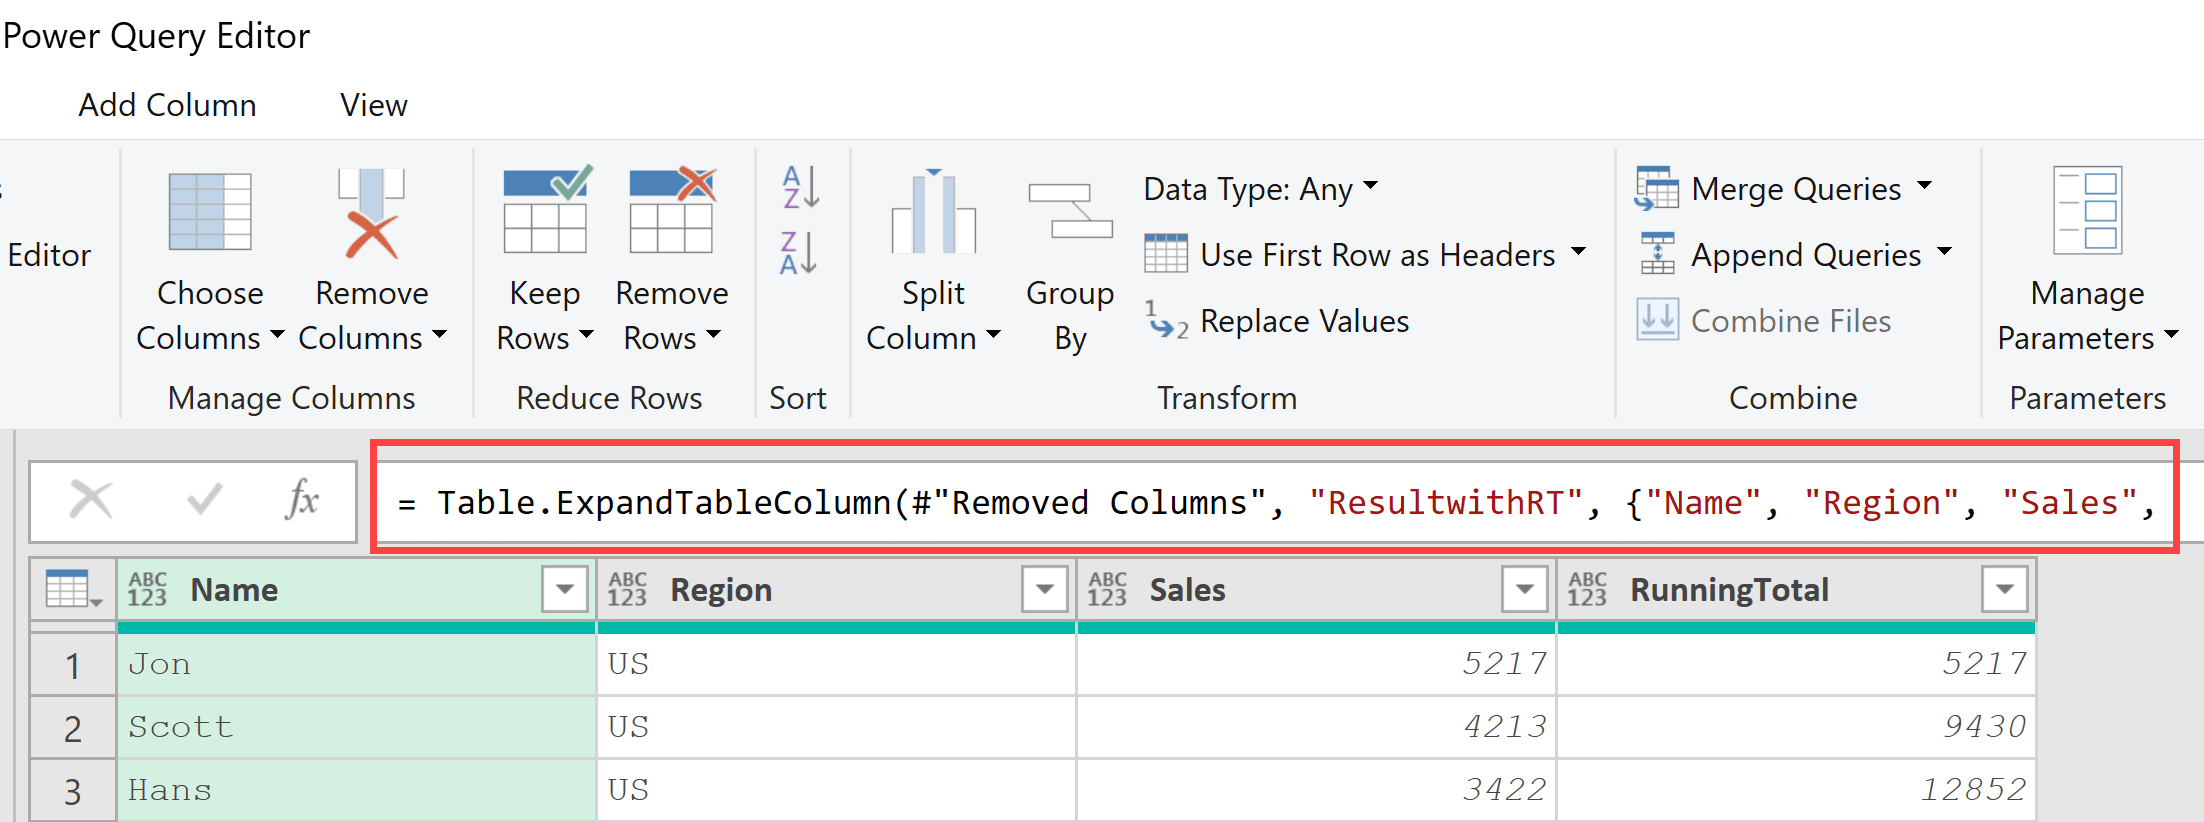
This shows you the M code formula for whatever step is currently selected in your Applied Steps.
It’s a nice middle ground between the visual interface and the full Advanced Editor – you can see exactly what Power Query is doing for each step without being overwhelmed by the entire code.
The Advanced Editor – For the Brave
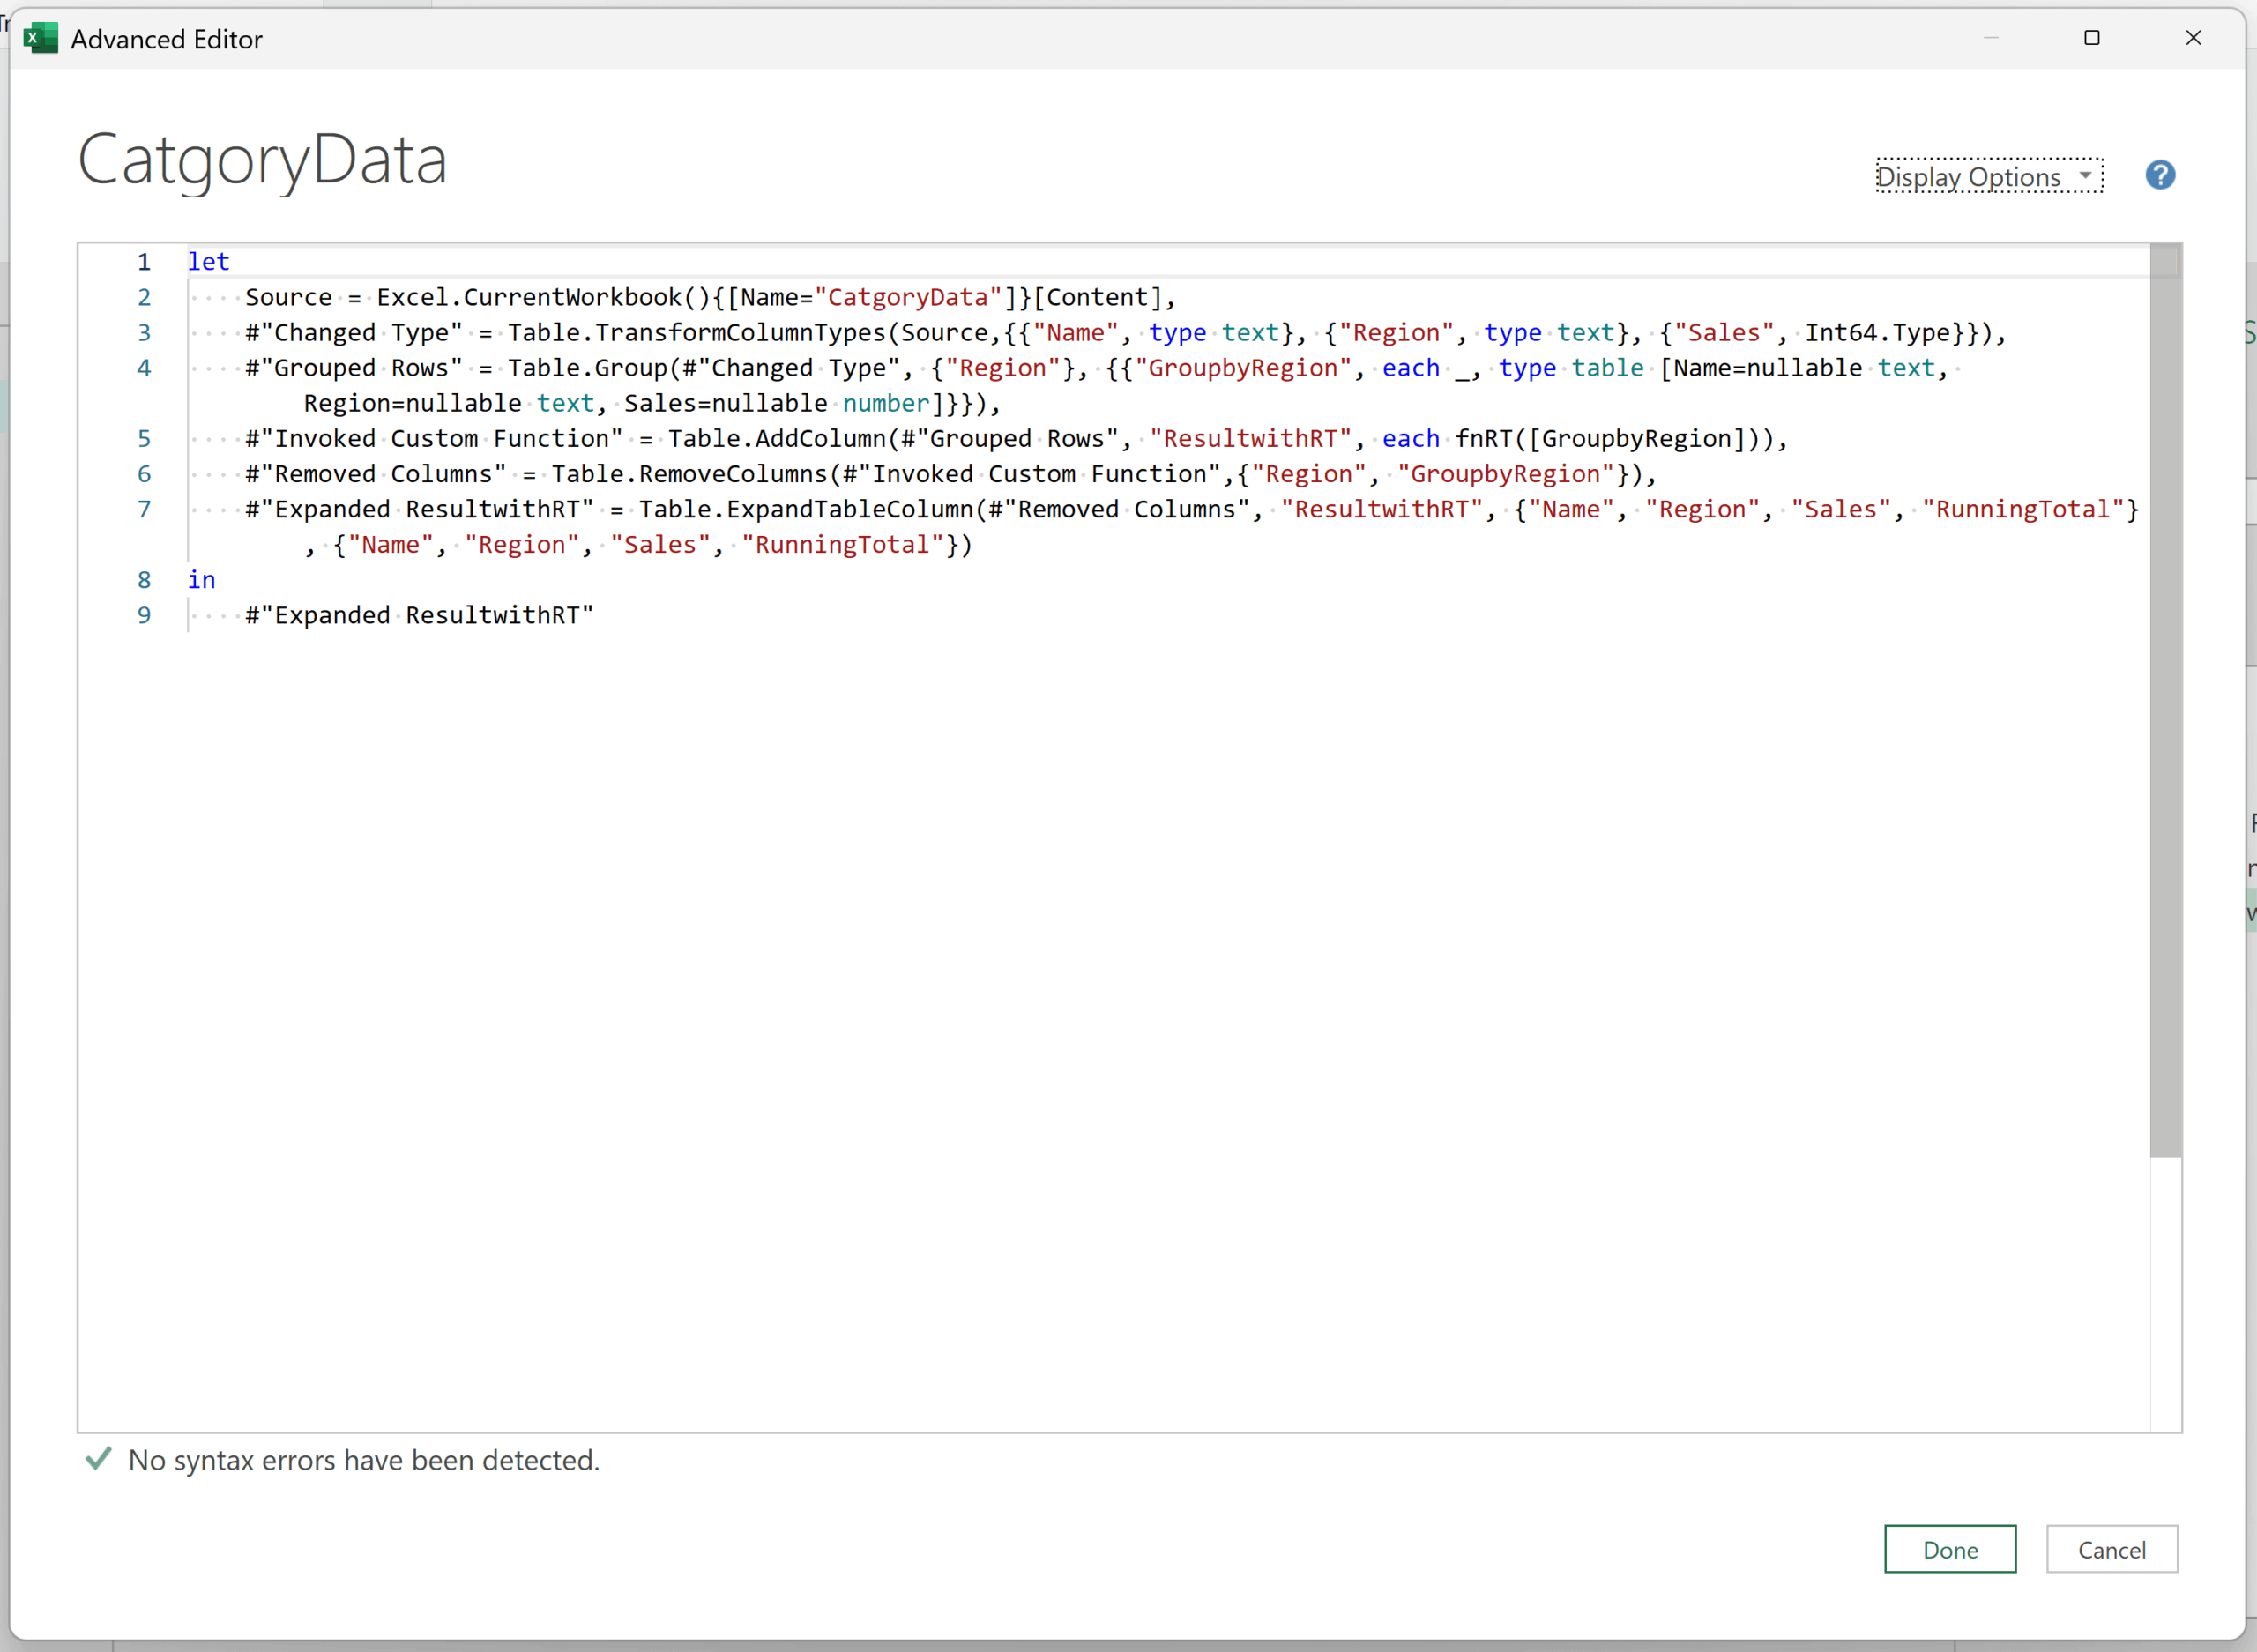
If you click on “Advanced Editor” in the View tab, you’ll see the M code that Power Query generates behind the scenes for all your transformations.
Most of the time, you won’t need to touch this code – the graphical interface handles everything for you. But if you want to get really advanced with Power Query, learning to read and write M code opens up a whole new world of possibilities.
Don’t worry if the M code looks intimidating at first. You can accomplish 95% of what you need using just the ribbon options and never touching a line of code.
Now that you know your way around the Power Query Editor interface, you’re ready to start transforming your data like a pro!
Common Data Transformations in Power Query
Now that you’re familiar with the Power Query Editor interface, let’s look at some of the most common transformations you’ll be doing with your data.
These are the bread-and-butter operations that you’ll use in almost every Power Query project.
Cleaning Data (removing duplicates, handling errors, replacing values, trimming/cleaning text)
Data cleaning is probably where you’ll spend most of your time, and Power Query makes it surprisingly easy.
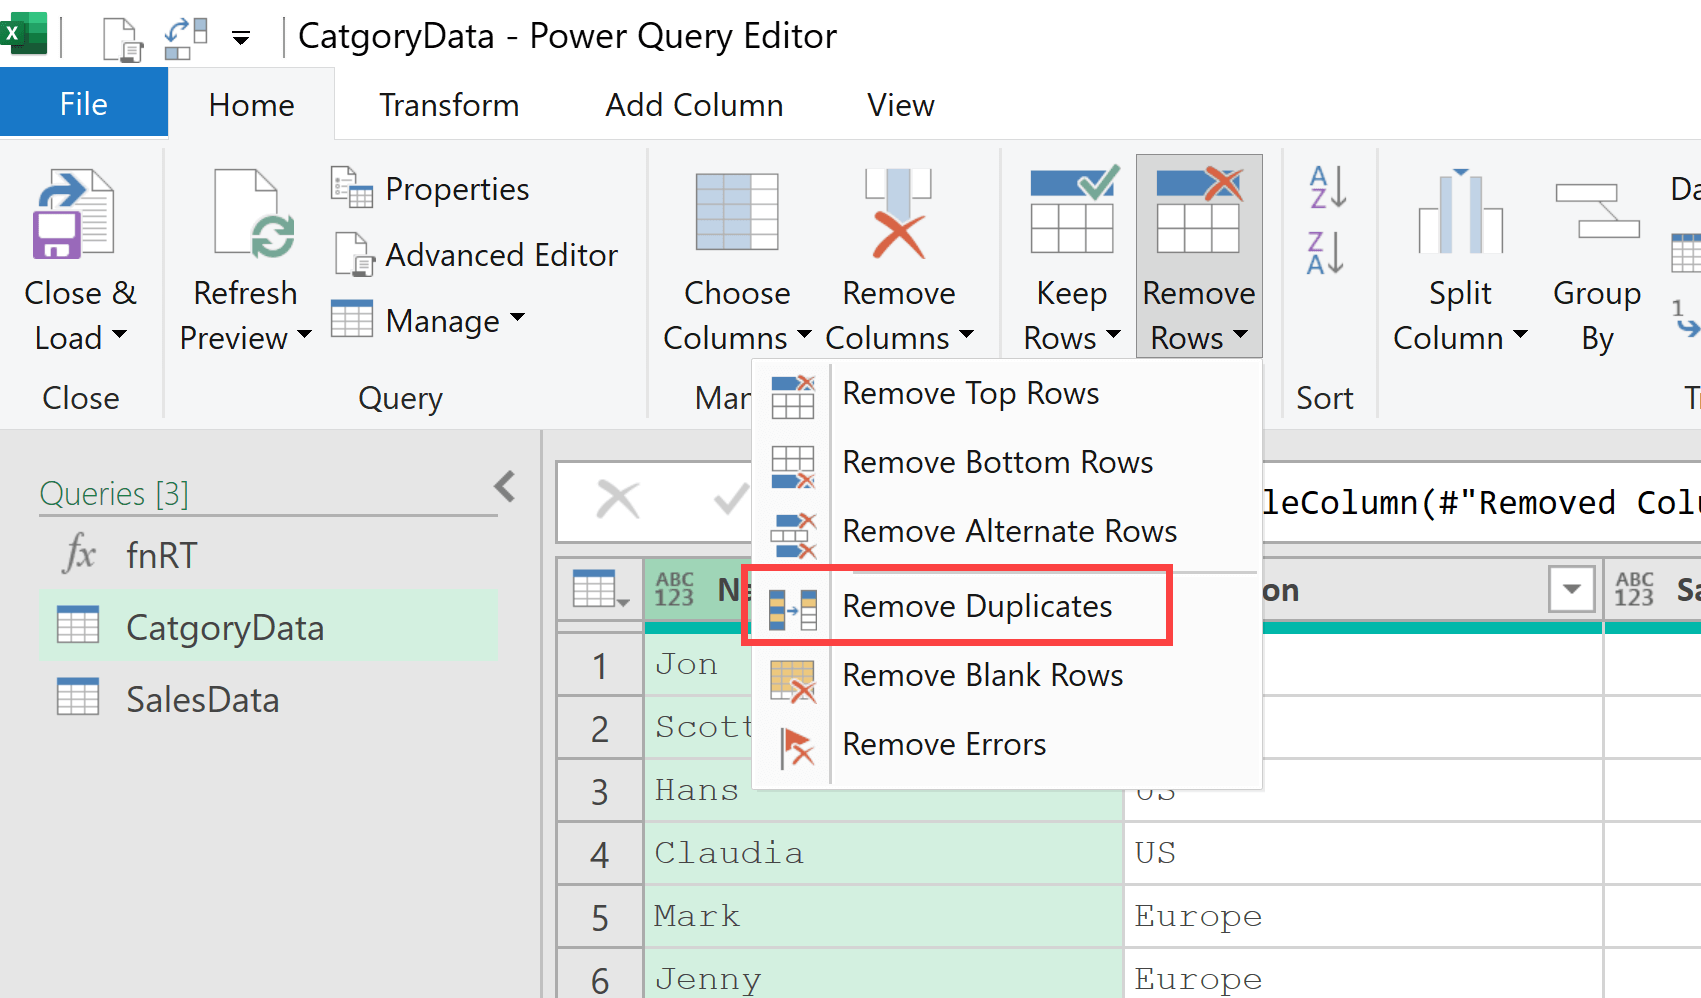
Removing duplicates is as simple as selecting your columns, then clicking the Home tab, and selecting the “Remove Duplicates” option in the Remove Rows drop down. Power Query will identify and eliminate duplicate rows based on the columns you’ve selected.
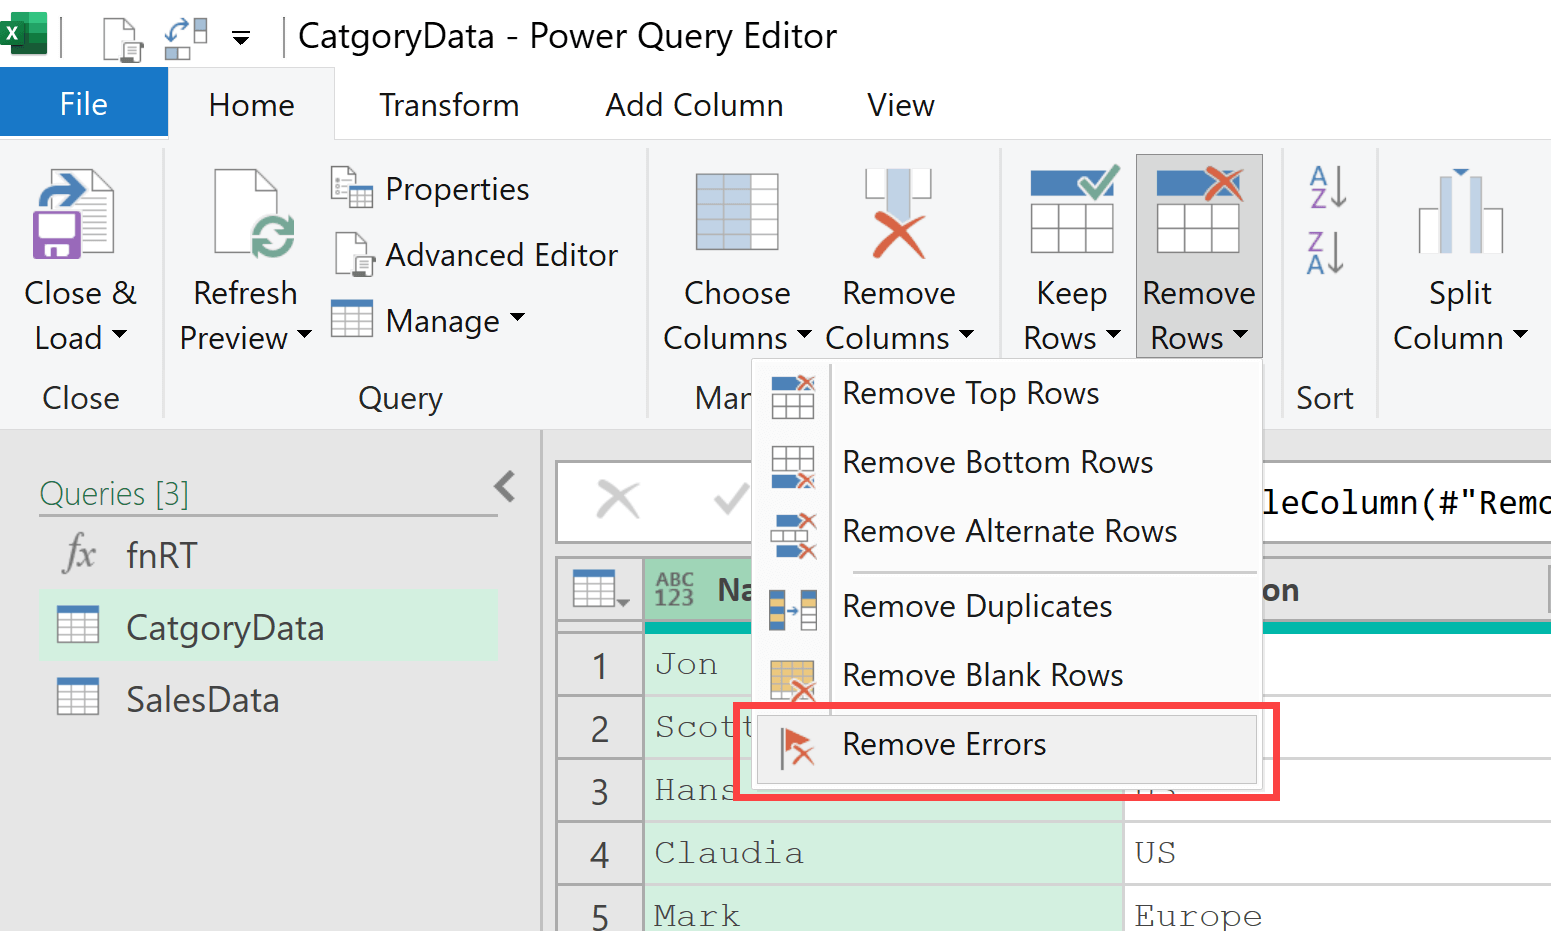
When your data has errors (those cells that show “Error”), you can handle them gracefully using error handling option. Select the column from which you want to remove the errors and then go to the Home tab and click on Remove Rows. In the dropdown that opens, you will find the Remove Errors option.
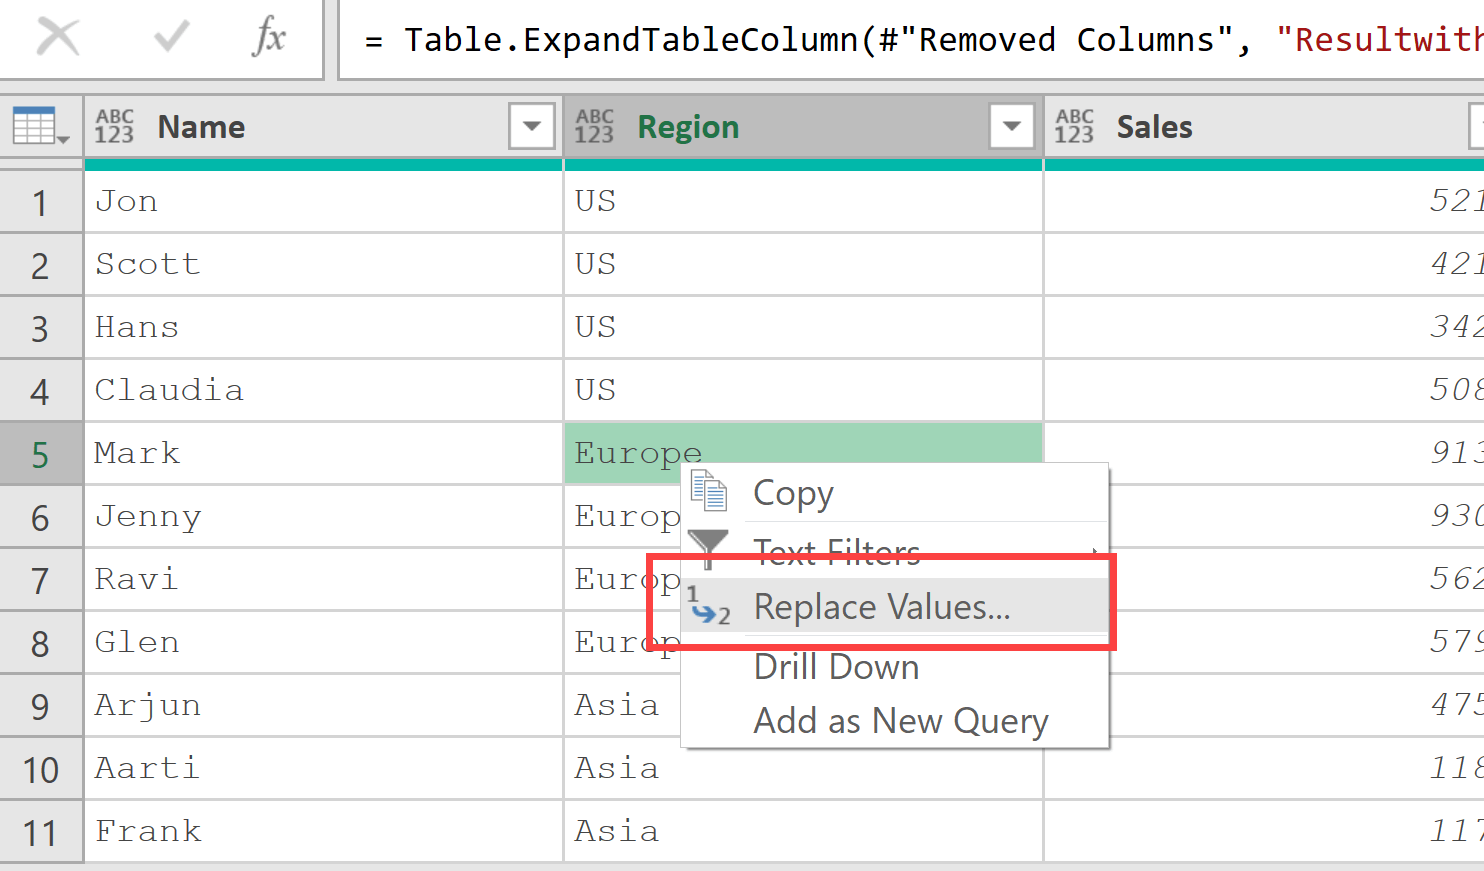
Replacing values is incredibly straightforward – just right-click on any cell and choose “Replace Values” to swap out unwanted text or numbers across the entire column.
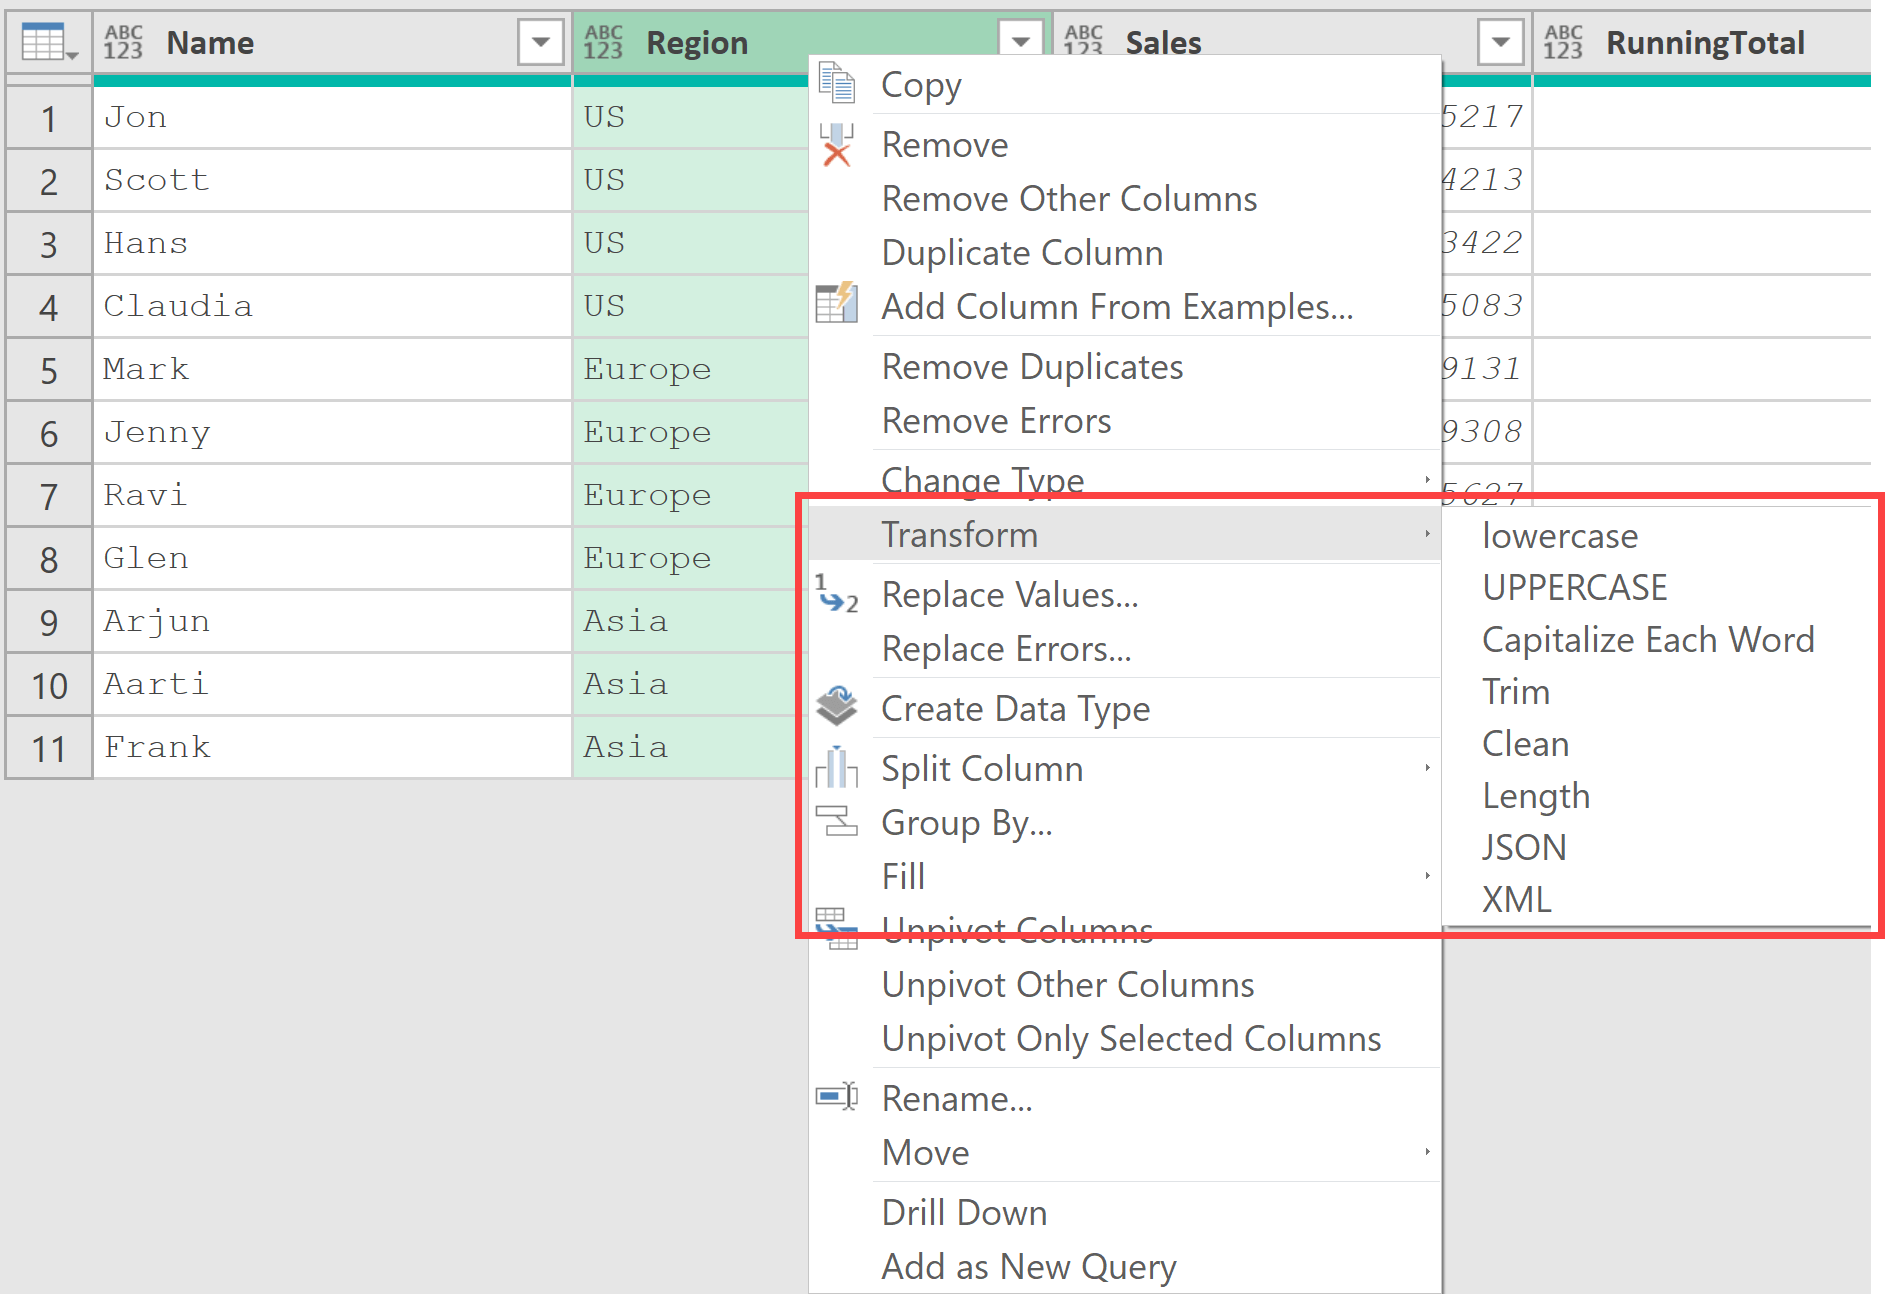
And for messy text data, there are a lot of transform options that become available when you right click on any of the columns.
Restructuring Data (pivoting, unpivoting, transposing, grouping)
Sometimes your data is organized in a way that makes analysis difficult, and that’s where restructuring comes in.
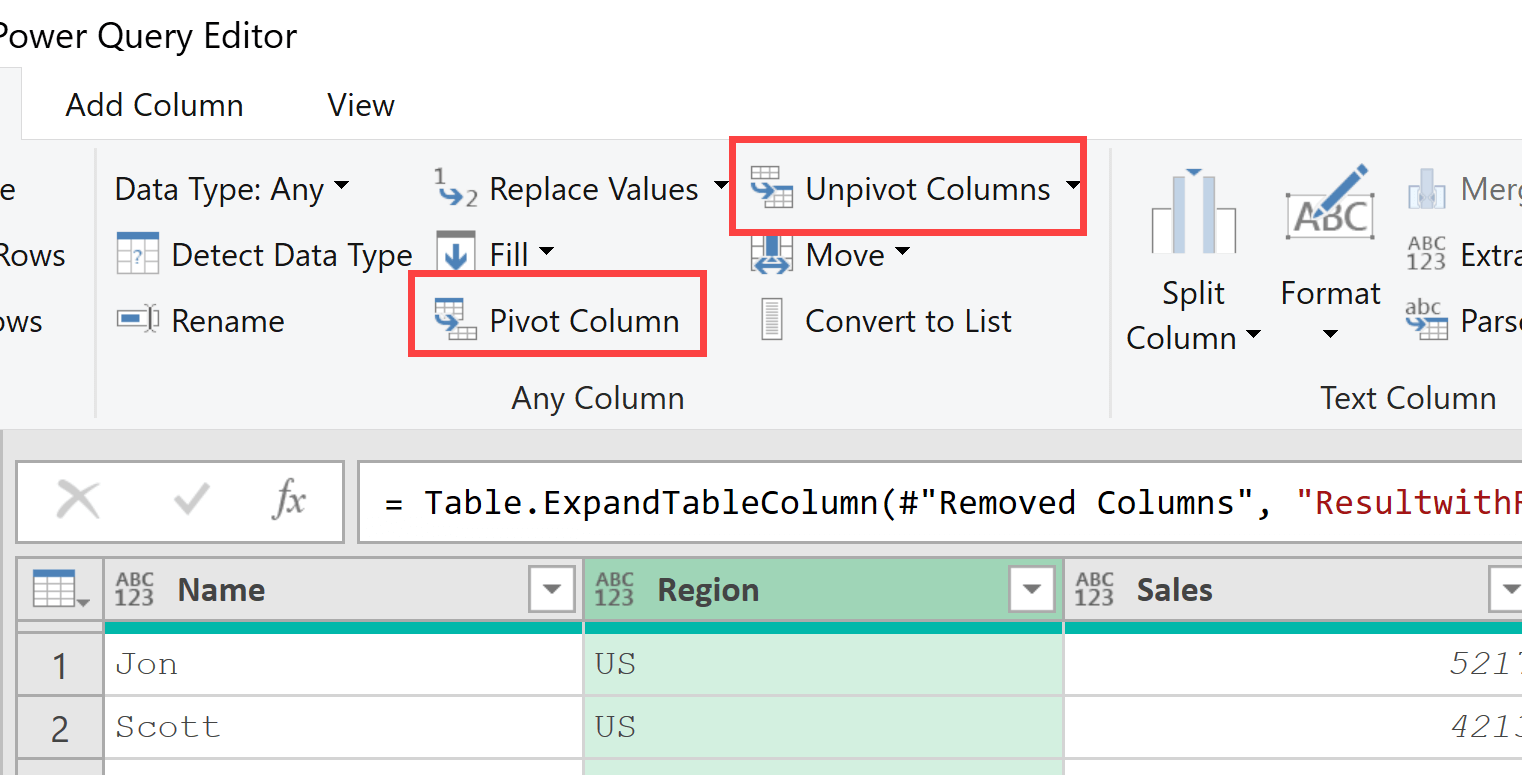
Pivoting takes data from a long format and spreads it into a wide format – perfect for creating summary tables. Unpivoting does the opposite, taking wide data and making it long, which is often better for analysis.
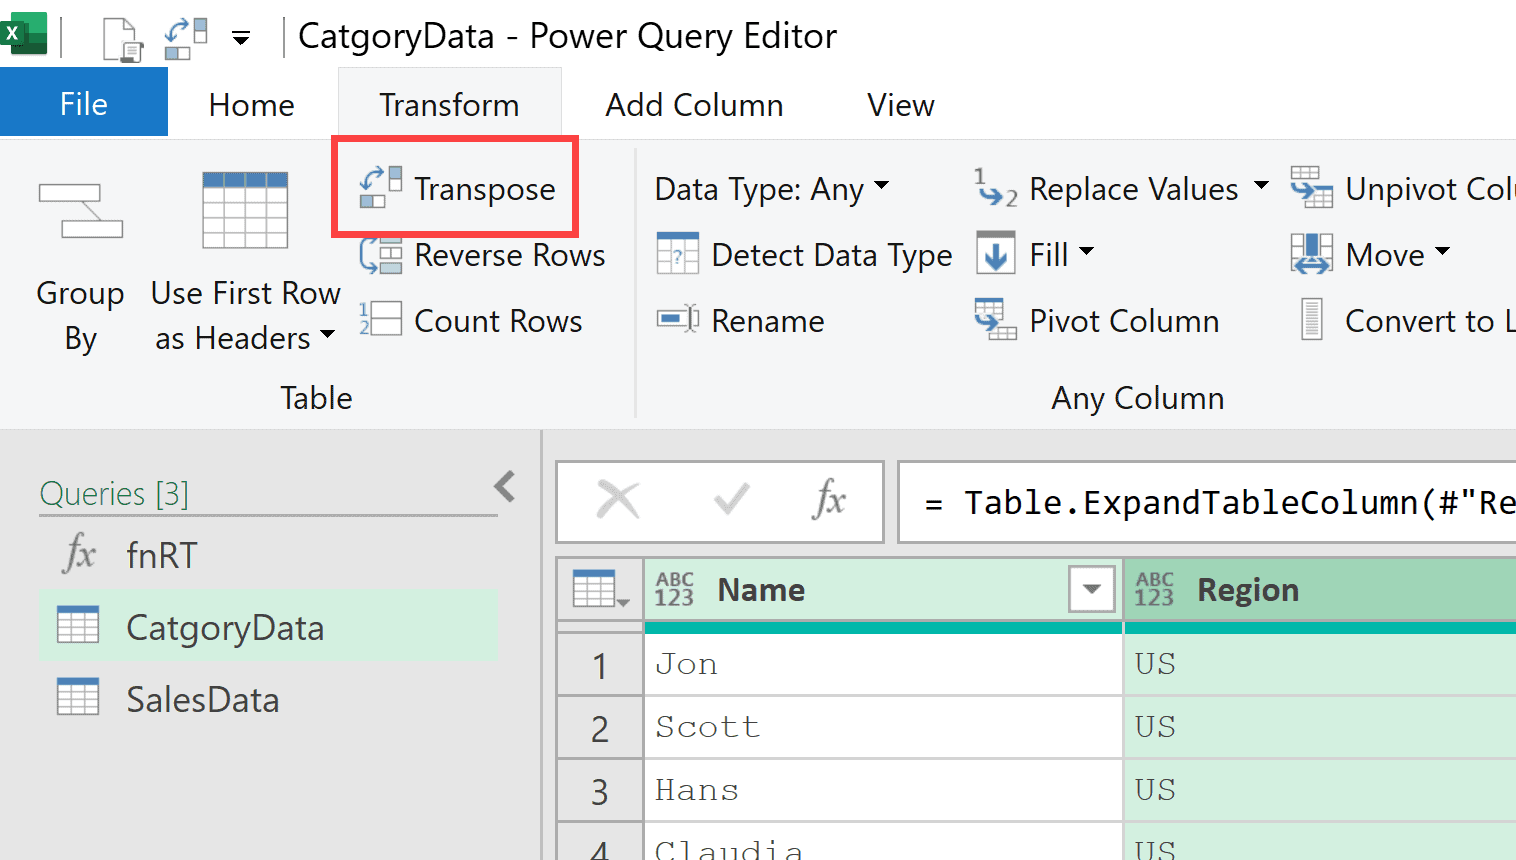
Transposing flips your data so that rows become columns and columns become rows.
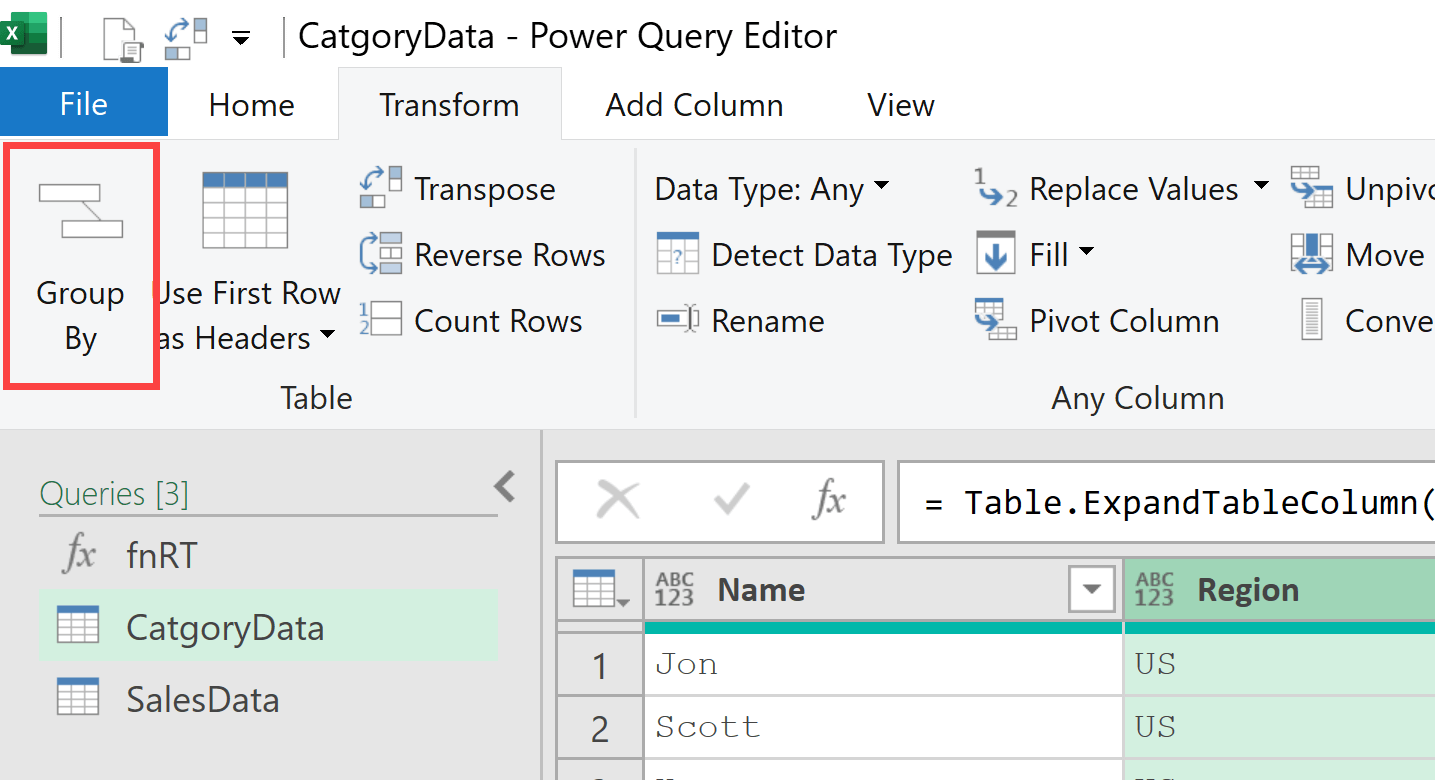
And the Group By function lets you aggregate your data – for example, getting total sales by region or average scores by department.
Adding Custom / Conditional columns
Power Query makes it easy to create new columns based on your existing data.
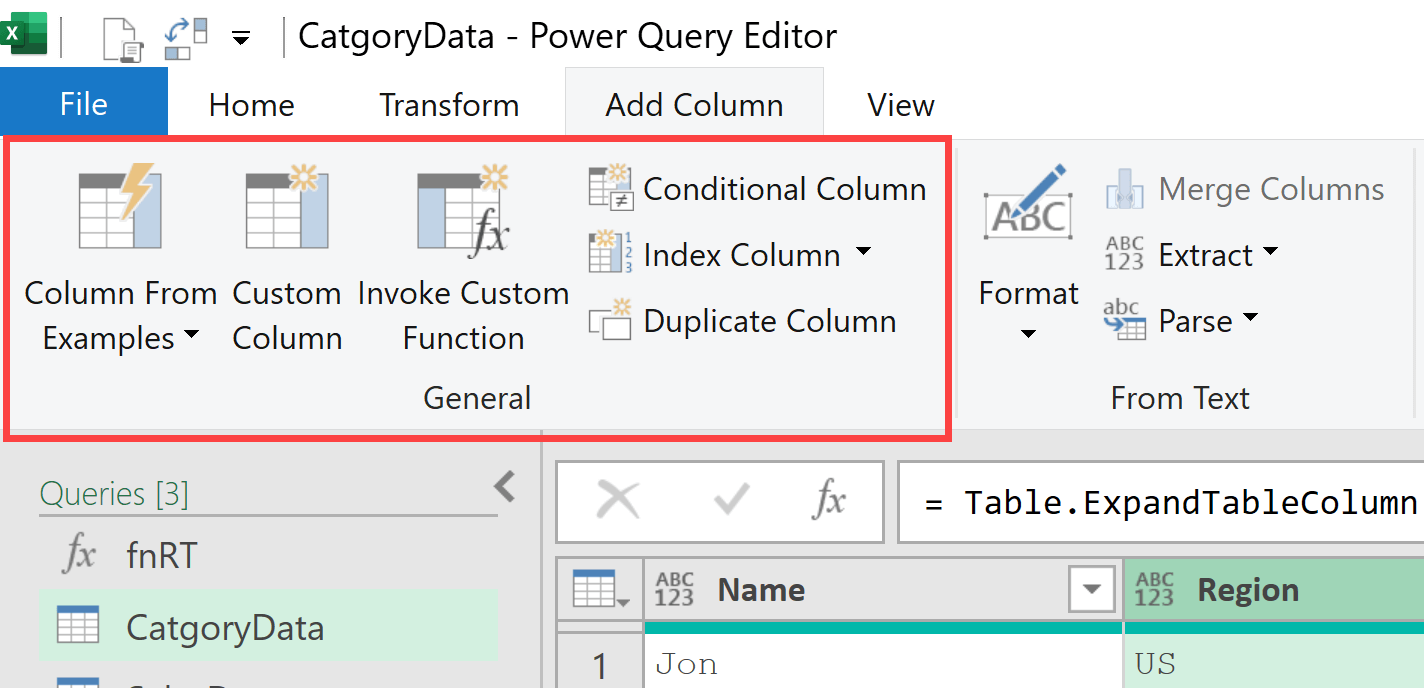
Custom Column option let you write your own formulas to create calculated fields. You can use simple math operations or more complex logic. You can also use Power Query functions and other statements such as try.. otherwise and each _.
Conditional Columns are perfect for creating categories based on rules – like flagging high-value customers or categorizing sales performance. This is similar to using an IF function in Excel and applying it for the entire column.
With the Index columns option, you can insert a new column that gives you serial number starting from 0 or 1. While this may seem like a simple thing, it’s super useful in many data transformation scenarios.
Merging & Appending Queries
Power Query makes it really easy for you to merge and append datasets.
Merging combines data horizontally – it’s like doing a VLOOKUP to bring related information from another table based on a common field. Use this when you want to add more columns to your existing data.
Appending combines data vertically – it stacks tables on top of each other. This is perfect when you have multiple files with the same structure (like monthly sales reports) that you want to combine into one dataset.
Date & Time Transformations (extract year/month/day, calculate durations, etc.)
Working with dates and times is where Power Query really shines compared to regular Excel formulas.
You can easily extract parts of dates (like year, month, or day) to create new columns, calculate the difference between dates, or add/subtract time periods.
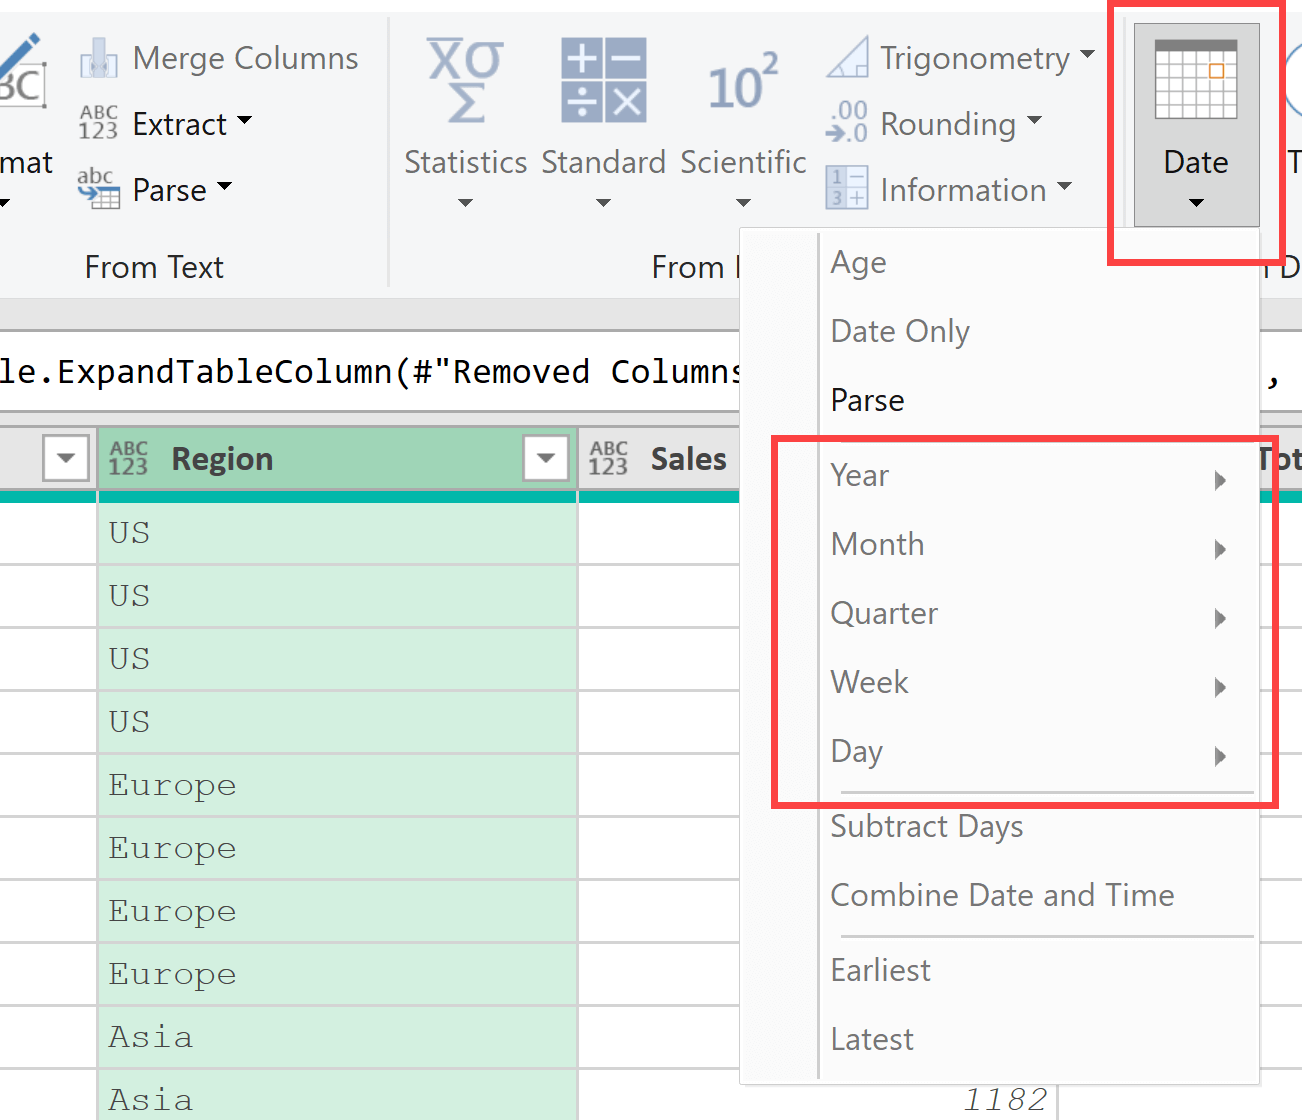
Power Query handles all the complex date arithmetic for you, making it much easier to create time-based analysis.
Text Manipulations (split column, merge columns, extract text)
Text data often needs the most cleanup, and Power Query has you covered.
Split Column lets you break apart text based on delimiters (like splitting full names into first and last names).
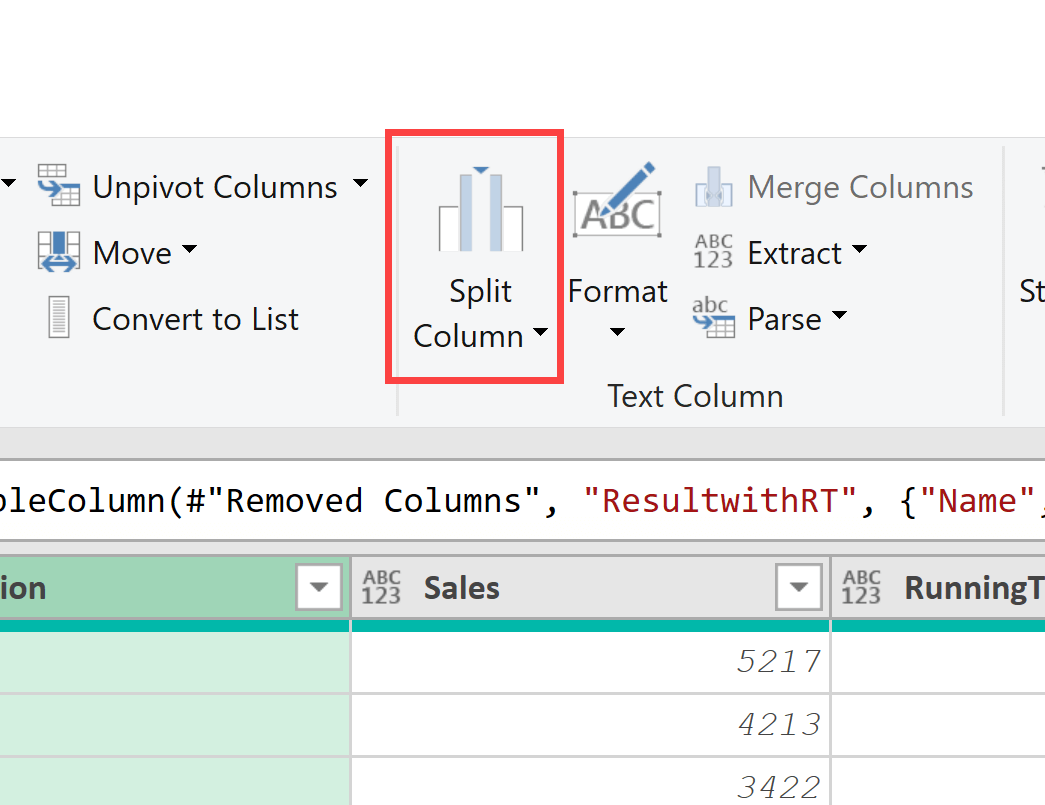
Merge Columns does the opposite, combining multiple text fields into one.
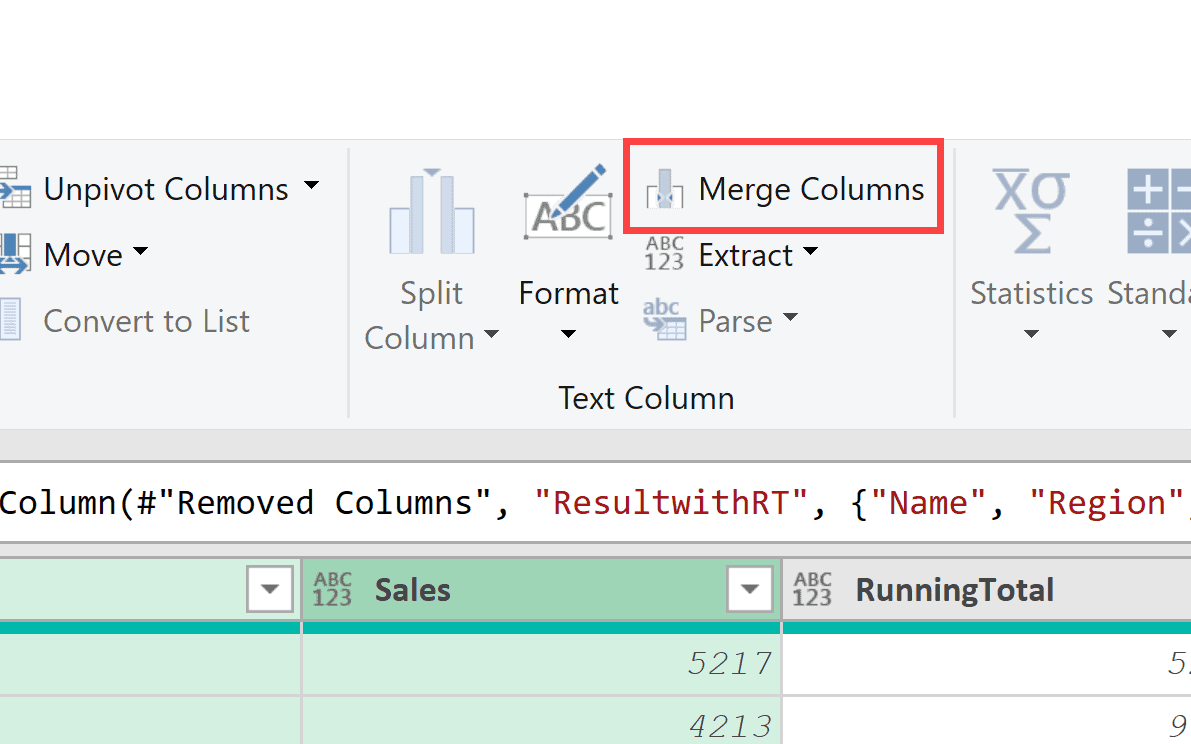
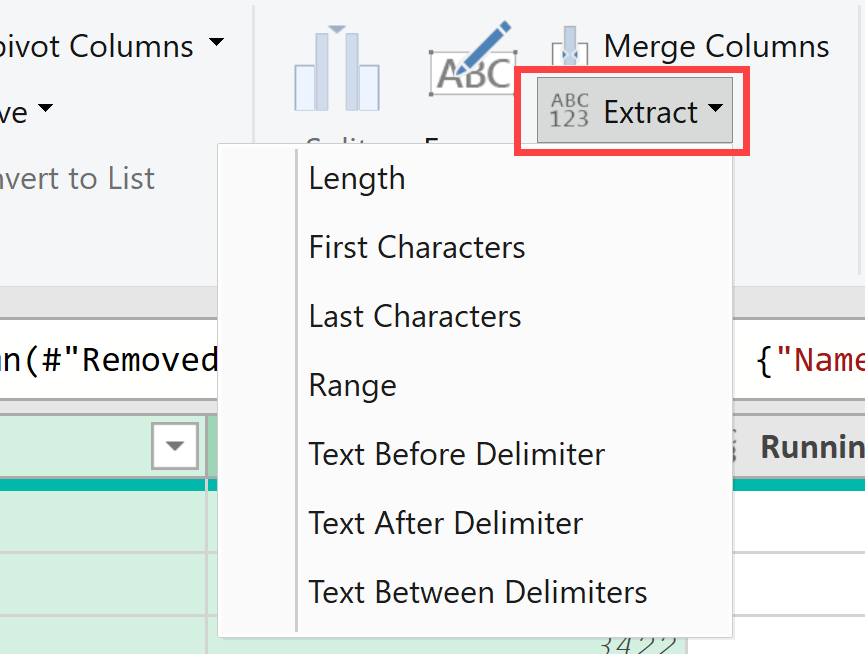
Extract options help you pull out specific parts of text strings, and various formatting options help you standardize text data across your dataset.
Data Types in Power Query
Understanding data types in Power Query is crucial for getting your data analysis right.
Think of data types as telling Power Query what kind of information you’re working with – whether it’s text, numbers, dates, or something else entirely.
Available Data Types
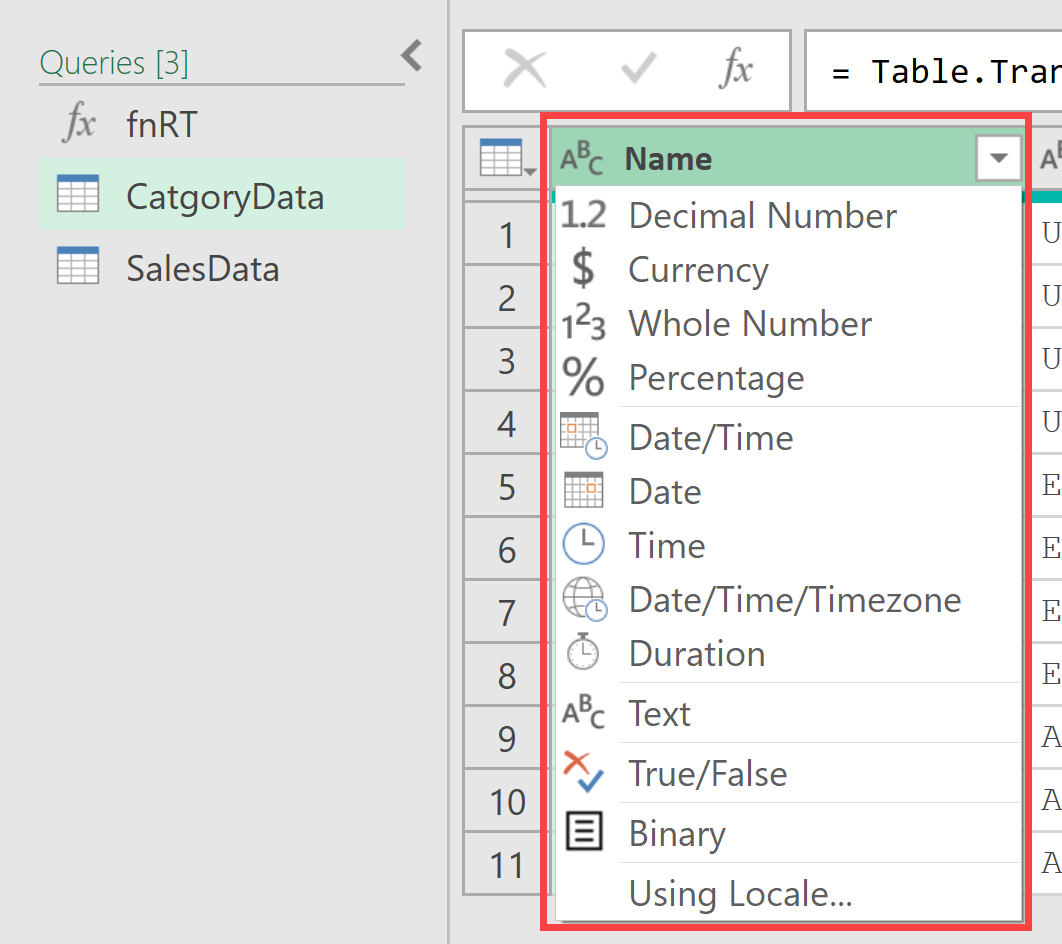
Power Query offers several data types to handle different kinds of information:
- Text – This is for any text-based information like names, addresses, or product descriptions. Even numbers can be stored as text if you’re not planning to do calculations with them (like ZIP codes or phone numbers).
- Whole Number – For counting numbers without decimals, like quantities, ages, or scores.
- Decimal Number – For numbers that might have decimal places, such as prices, percentages, or measurements.
- Date – Specifically for dates without time information.
- Date/Time – For when you need both date and time together, like timestamps.
- Time – Just for time information without the date.
- True/False – Also called Boolean, this is for yes/no, true/false type of data.
- Binary – For files, images, or other binary data (you probably won’t use this much in typical data analysis).
The ones that I have listed above are the primitive data types in Power Query. There are also structured data types such as lists, records, tables and functions.
Type Detection and Conversion
Here’s something really helpful: Power Query is pretty smart about figuring out what type of data you have.
When you first import data, it automatically looks at your columns and tries to assign the most appropriate data type.
You’ll see this happen in your Applied Steps as “Changed Type” – that’s Power Query making its best guess about your data types.
But sometimes it gets it wrong. Maybe it thinks your product codes are numbers when they should be text, or it misses that a column contains dates. No worries – you can easily fix this.
To change a data type, just click on the small icon next to the column name (it looks like “ABC” for text, “123” for numbers, or a calendar for dates). You’ll get a dropdown menu where you can select the correct data type.
When you change data types, Power Query will try to convert your data. If it can’t convert something (like trying to turn “hello” into a number), it will show an error in that cell. You can then decide whether to handle those errors or clean up the data first.
Working with Locale-Specific Formats
This is where things can get tricky, especially if you’re working with data from different countries or regions.
Different places format numbers and dates differently. For example, in the US, you might write a date as 12/31/2023, but in Europe, it might be 31/12/2023. Similarly, some countries use commas as decimal separators (like 1,25) while others use periods (1.25).
Power Query tries to use your computer’s regional settings to understand these formats, but sometimes you need to be more specific. When you’re changing data types, you can click on the small dropdown arrow next to the data type and choose “Using Locale” to specify exactly how your data is formatted.
This is particularly important when working with dates and numbers from international sources. Getting this right prevents Power Query from misinterpreting your data.
The key is to think about data types early in your Power Query process. Getting them right from the start saves you headaches later when you’re trying to create calculations, pivot tables, or visualizations.
Remember: if your data types are wrong, everything downstream will be wrong too. It’s worth taking the time to get this foundation solid before moving on to more complex transformations.
Functions in Power Query
Here’s something really cool about Power Query: whenever you’re clicking buttons and making transformations in the interface, there’s a recorder working behind the scenes that converts every single action you take into functions and expressions.
Those steps you see in the Applied Steps panel? Each one is actually a function call written in Power Query’s M language.
When you click “Remove Duplicates” or “Split Column,” Power Query is automatically writing the corresponding function code for you.
Power Query comes packed with over 800+ built-in functions that can handle virtually any data transformation you can imagine. These functions cover everything from simple text manipulation to complex statistical calculations.
For example, when you use the interface to convert text to proper case, Power Query is actually using the Text.Proper() function behind the scenes. When you add days to a date, it’s using Date.AddDays().
The beauty is that you don’t need to know or memorize any of these functions to use Power Query effectively. The ribbon interface handles all the function calls for you automatically.
But understanding that these functions exist means you can tackle more complex data challenges when you’re ready to dive into custom formulas and M code.
This recorder system is what makes Power Query so powerful – you get the simplicity of point-and-click with the flexibility of a full programming language working behind the scenes.
Also see: Power Query Functions
M-Code (The Power Behind Power Query)
Remember how I mentioned that Power Query records everything you do as functions and expressions? Well, all of that gets written in a language called M-Code (or just “M” for short).
M-Code is the programming language that powers everything in Power Query.
Every click, every transformation, every data connection – it all gets translated into M-Code behind the scenes.
You Don’t Need to Learn M-Code (But if you do, you can do what seems impossible)
Here’s the great news: you can become incredibly proficient with Power Query without ever writing a single line of M-Code. The visual interface handles 95% of what most people need to do.
But knowing that M-Code exists gives you confidence that if you ever run into a data challenge that seems impossible with the standard interface, there’s probably a way to solve it with some custom M-Code.
So don’t feel pressured to learn M-Code right away – Power Query is already incredibly valuable without it. But know that if you ever hit a wall with the visual interface, M-Code is there to break through it and make the impossible possible.
Here is a video that covers the basics on M code.
Where You Might Encounter M-Code
You’ll see M-Code in a few places:
- The Formula Bar shows you the M-Code for whatever step is currently selected in your Applied Steps panel. Most of the time, you can just ignore this, but it’s helpful for understanding what’s happening.
- The Advanced Editor (found in the View tab) shows you the complete M-Code for your entire query. This is where you’d go if you needed to make advanced modifications that aren’t possible through the interface.
Example of a Simple M-Code
Here’s what a basic M-Code step might look like:
#"Changed Type" = Table.TransformColumnTypes(Source,{{"Sales", type number}})This line is telling Power Query to take the source data and change the “Sales” column to a number data type. Pretty readable, right?
The Beauty of Generated M Code
The brilliant thing about Power Query is that it writes clean, well-structured M-Code for you. Even if you never plan to write M-Code yourself, the code that gets generated is logical and follows best practices.
This means that if you ever do decide to learn M-Code later, you can look at the code Power Query has been writing for you and learn from it. It’s like having a mentor showing you the right way to do things.
For now, just know that M-Code is there, working quietly in the background, making all your data transformations possible. You can go months or even years using Power Query effectively without ever needing to touch a line of code – but it’s reassuring to know that incredible power is there when you need it.
What Power Query is Not?
While Power Query is incredibly powerful, it’s important to understand what it’s designed for – and what it’s not.
Setting the right expectations will help you use it more effectively and avoid frustration.
Power Query is not a Database Itself
Power Query is a data transformation and connection tool, not a place to store your data permanently.
Think of it as a sophisticated data processor that takes information from various sources, cleans it up, and delivers it to where you actually want to store it (like Excel worksheets or data models).
You wouldn’t use Power Query as your customer database or inventory system. Instead, you’d use it to pull data from those systems, clean it up, and prepare it for analysis.
Power Query is not for Data Entry
If you need to manually input new records or edit individual data points, Power Query isn’t your tool. It’s designed for transforming existing data, not for creating new data from scratch.
You won’t find forms, input screens, or user-friendly data entry interfaces in Power Query. For that, you’d stick with regular Excel worksheets, Access forms, or dedicated data entry applications.
Power Query is not for general-purpose automation (outside of ETL)
Power Query excels at ETL processes (Extract, Transform, Load), but it’s not a general automation platform.
You can’t use it to send emails, create file backups, or automate non-data-related tasks.
It’s specifically built for data workflows – getting data from point A to point B while cleaning and transforming it along the way.
If you need broader automation capabilities, you’d look at tools like Power Platform, VBA, or other automation platforms.
Power Query is not a Replacement for Excel
This might be the most important point: Power Query doesn’t replace Excel – it supercharges it.
You still need Excel (or another analysis tool) to actually work with your cleaned data.
Power Query handles the messy work of getting your data ready, but you’ll still use Excel’s familiar features like pivot tables, charts, formulas, and functions to analyze that data once it’s clean. Or you can load your data into data models and then use Power BI to create visuals.
Think of Power Query as the ultimate prep cook in your data kitchen – it does all the chopping, cleaning, and organizing so you can focus on creating the final dish in Excel/Power BI.
Benefits of Using Power Query
- Automation: Once you set up your transformations, you can refresh your data with a single click and all your cleaning steps automatically apply to the new data. No more repeating the same tedious tasks every month when new data arrives.
- Data Cleansing Efficiency: Power Query can handle complex cleaning tasks (like splitting names, fixing inconsistent formats, or removing duplicates across multiple columns) that would require messy, complicated formulas in regular Excel.
- No Formula Mess: Your worksheets stay clean and focused on analysis rather than being cluttered with helper columns, complex VLOOKUP formulas, and data preparation calculations.
- Handles Large Datasets: Power Query can process hundreds of thousands of rows efficiently, while Excel formulas might slow down or crash when dealing with large volumes of data.
- Audit Trail: The Applied Steps panel shows exactly what transformations were performed and in what order, making it easy to understand, modify, or troubleshoot your data preparation process.
- Reduced Manual Errors: Since transformations are automated and repeatable, you eliminate the human errors that come from manually copying, pasting, and reformatting data each time.
- Consistency in Data Preparation: Everyone on your team can use the same transformation steps, ensuring that data is prepared the same way every time, regardless of who’s doing the work.
Common Questions about Power Query
Below are some commonly asked questions about Power Query.
Is Power Query free?
Yes! Power Query comes built into Excel at no extra cost if you’re using Excel 2016 or later, Excel for Microsoft 365, or Excel on the web. For older versions (Excel 2010/2013), you can download it as a free add-in from Microsoft.
Do I need to learn M Code to use Power Query?
Not at all. You can accomplish most data transformation tasks using just the point-and-click interface. M Code is only needed for advanced scenarios that go beyond what the visual tools can handle. But if you are already proficient with the Power Query interface, I recommend you learn M code.
Can Power Query crash Excel?
Occasionally, yes, especially when working with very large datasets or complex transformations. However, Power Query is generally quite stable, and any crashes are usually related to memory limitations rather than Power Query itself being unreliable.
How is Power Query different from formulas?
Formulas calculate results in real-time and live in your worksheet cells, while Power Query transforms your data once and loads the clean results. Think of formulas as ongoing calculations and Power Query as a one-time data preparation process that you can refresh when needed.
Is it difficult to learn M Code?
M Code has a learning curve, but it’s more approachable than most programming languages. The syntax is fairly readable, and you can start by examining the code Power Query generates for you. Most people can pick up basic M Code concepts within a few weeks of focused learning.
Can I share Power Query solutions with others?
Yes! You can share Excel files containing Power Query connections, and others can refresh the data (as long as they have access to the same data sources). You can also copy and paste queries between workbooks or export/import M Code to share specific transformations.
Does Power Query slow down my Excel file?
Power Query queries themselves don’t slow down your file significantly, but large datasets loaded into Excel can impact performance. Loading to the Data Model instead of worksheets, or using “Connection Only” for intermediate queries, helps keep files responsive.
In this article I’ve tried to give you an overview of this amazing, powerful tool called Power Query. While it’s not possible for me to cover everything about PowerPerry, I have given relevant videos and links to articles that you can open and explore to learn more about any specific topic.
I hope you found this article helpful and I hope Power Query helps you in your data wragling efforts.
In case you have any questions or comments, do let me know.
Other Power Query articles you may like:
- Power Query Shortcuts
- Merge Tables in Excel Using Power Query
- Combine Data from Multiple Workbooks in Excel (using Power Query)
- Combine Data From Multiple Worksheets into a Single Worksheet in Excel
- Get a List of File Names from Folders & Sub-folders (using Power Query)
- How to Undo in Power Query
- Combine CSV Files When Column Headers Don’t Match
- Get Today’s Date in Power Query
- Calculate Date Difference in Power Query


