
If you’re looking for some sample data in Excel, here you’ll find 15 expertly created sample data sets by industry that you can download and use in your work.
If you prefer creating your own data set with customization, click here to use the sample data generator for Excel.
Sample Excel Datasets by Industry
A curated collection of 15 ready-to-use Excel datasets spanning different industries and domains.
Each file contains 1,000 rows of realistic sample data, perfect for practice, learning, and building projects.
Retail Inventory Sample Data
This dataset gives you a snapshot of a retail store’s product inventory. It covers everything from product details and supplier info to stock levels and pricing.
You’ll find columns like Product ID, Product Name, Category, Supplier Name, Unit Cost, Retail Price, Opening Stock, Units Sold, Closing Stock, Reorder Point, and Stock Status.
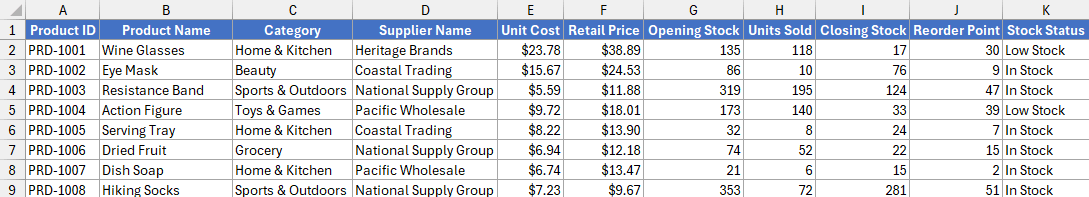
Each row represents a single product, showing how much stock was available, how many units moved, and whether the item needs restocking.
The Stock Status column flags products as “In Stock” or “Low Stock,” which makes it super handy for filtering and alerts.
This data is great for practicing inventory management analysis, building reorder dashboards, calculating profit margins (retail price vs. unit cost), or exploring category-level trends.
If you’re learning pivot tables or conditional formatting, this one’s a solid starting point.
Project Management Dataset
Here’s a dataset that simulates a multi-project work environment with tasks, timelines, and budgets.
The columns include Project Name, Task Name, Assigned To, Priority, Planned Start Date, Planned End Date, Actual End Date, % Complete, Planned Budget, Actual Cost, and Status.
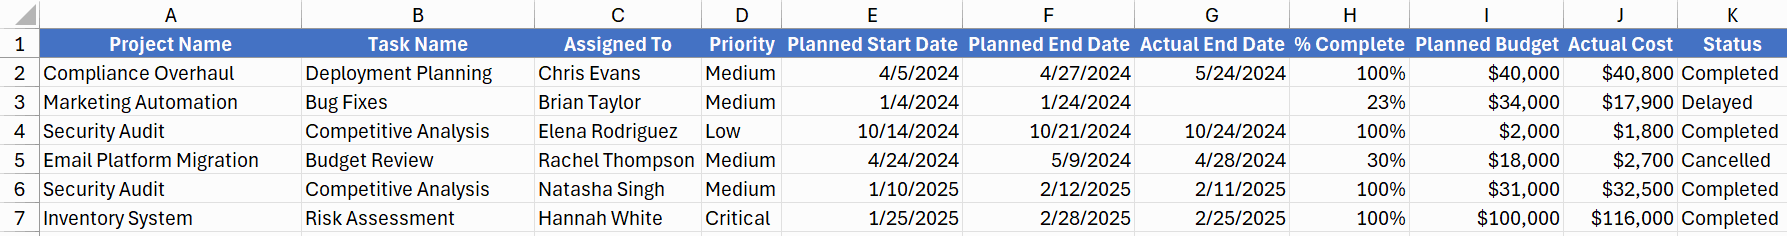
Each row is a single task within a larger project. You’ll see tasks in various states (Completed, Delayed, or In Progress), along with how far along they are and whether they came in under or over budget. Some tasks have no Actual End Date yet, meaning they’re still open.
This is a fantastic dataset for building Gantt charts, tracking project health, analyzing budget variances, or identifying bottlenecks by team member or priority level. It’s also great for practicing date calculations like task duration or days overdue.
Real Estate Listings Dataset in Excel
This one’s all about property listings across different U.S. cities and states.
You’ll find columns for Listing ID, Property Type, City, State, Bedrooms, Bathrooms, Square Footage, Year Built, List Price, Sale Price, and Listing Status.
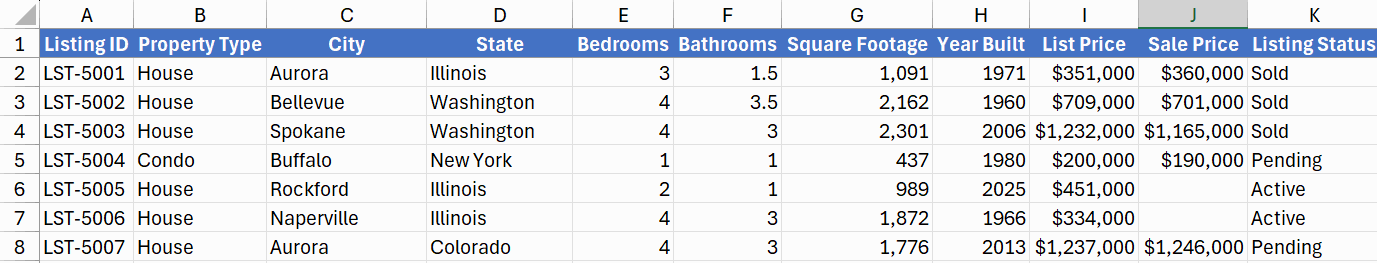
Each row is a single property listing (houses, condos, townhouses) with details on size, location, and pricing. The Listing Status tells you whether the property was sold, is still active, or is pending. Comparing List Price vs. Sale Price opens up some interesting analysis possibilities.
This dataset works really well for real estate market analysis, price-per-square-foot calculations, geographic comparisons, and building interactive dashboards. It’s also a fun one for practicing VLOOKUP or INDEX-MATCH across location-based data.
Restaurant Sales Sample Practice Dataset
A tasty dataset covering restaurant transactions across multiple locations.
The columns are Transaction ID, Order Date, Restaurant Location, Order Type, Menu Item, Category, Quantity, Unit Price, Order Total, and Customer Rating.
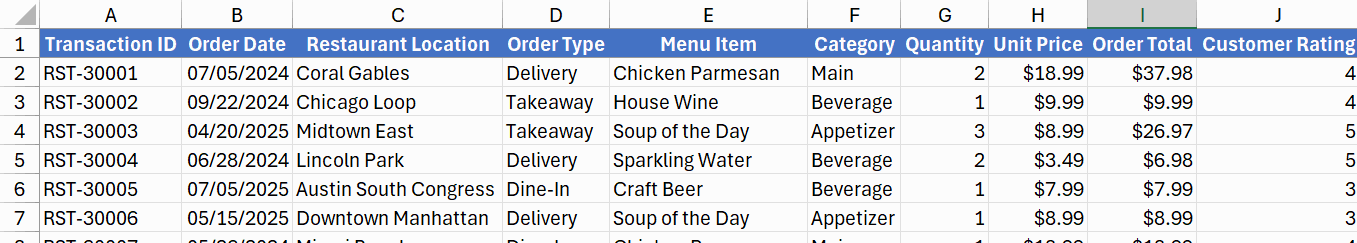
Every row captures a single order (what was ordered, where, how), and how the customer rated the experience. Menu items span across categories like Mains, Appetizers, Beverages, and Desserts.
This is perfect for sales trend analysis, location-level performance comparisons, figuring out which menu items are the top sellers, and correlating order types with customer satisfaction.
If you want to practice time-series analysis by order date or build a restaurant performance dashboard, this dataset has you covered.
SaaS Subscriptions Sample Data in Excel
This dataset models a SaaS company’s customer base with subscription and revenue details.
Columns include Customer ID, Company Name, Country, Subscription Plan, Billing Cycle, Subscription Start Date, Monthly Recurring Revenue (MRR), Monthly Active Users, Churn Flag, and Churn Reason.
Each row represents one customer account, showing their plan tier (Starter, Professional, Enterprise), whether they pay monthly or annually, and whether they’ve churned. For churned customers, there’s a reason provided, like “Competitor,” “Budget,” or “Lack of Features.”
This is a goldmine for SaaS metrics practice: calculating churn rates, analyzing MRR by plan or country, segmenting customers by engagement (active users), and understanding why customers leave. Great for anyone learning about subscription business models or building KPI dashboards.
Support Tickets Sample Dataset
A customer support dataset that tracks tickets from creation to resolution.
You’ll see Ticket ID, Created Date, Resolved Date, Channel, Issue Category, Priority, Assigned Agent, Resolution Time (Hours), SLA Met, and Customer Satisfaction.
Each row is a single support ticket, showing how it came in (Email, Phone, Chat), what the issue was about (Technical, Billing, Shipping, etc.), and how quickly it was resolved. The SLA Met column tells you whether the team hit their service-level target.
This data is excellent for support operations analysis – think average resolution times by category, agent performance tracking, SLA compliance rates, and satisfaction score trends. It’s a great pick if you want to build a customer service dashboard or practice time-based calculations.
Supply Chain Dataset
This dataset tracks shipments from order to delivery across multiple suppliers and carriers.
Columns include Shipment ID, Order Date, Supplier Name, Product Category, Quantity, Total Cost, Ship Date, Delivery Date, Shipping Carrier, Shipping Mode, and On-Time Delivery.
Each row represents a single shipment, capturing the full journey, when it was ordered, when it shipped, how it traveled (Road, Air, Sea, Rail), and whether it arrived on time. Product categories span things like Chemicals, Packaging, Raw Materials, and more.
This one’s tailor-made for supply chain analysis: calculating lead times, evaluating carrier reliability, tracking on-time delivery rates by shipping mode, and identifying supplier performance trends. If you’re into logistics dashboards or want to practice date-difference formulas, this is your dataset.
E-Commerce Orders Dataset in Excel
A classic e-commerce dataset with order-level detail including profitability.
The columns are Order ID, Order Date, Customer Name, Region, Product Name, Category, Quantity, Unit Price, Discount %, Total Revenue, Profit, and Ship Mode.
Each row is a single line item from a customer order, with products across categories like Electronics, Beauty, Clothing, and Home. You get both revenue and profit, plus discount percentages, which makes margin analysis straightforward.
If you need sample Excel data for practice in sales analysis, regional performance breakdowns, or profitability reporting, this dataset would be appropriate.
It’s also excellent for building end-to-end e-commerce dashboards and practicing formulas like revenue calculations with discounts.
Employee HR Records Dataset
An HR-focused dataset that covers employee demographics, compensation, and performance.
Columns include Employee ID, Full Name, Gender, Department, Job Title, Hire Date, Annual Salary, Performance Rating, Satisfaction Score, and Employment Status.
Each row represents an employee with their department, role, salary, and how they’re performing.
Performance Rating and Satisfaction Score are numerical, making them easy to analyze and visualize. Employment Status shows whether someone is Active or has been Terminated.
This is ideal for HR analytics (salary distribution by department, performance vs. satisfaction correlations, attrition analysis, tenure calculations, and diversity reporting). A great dataset for anyone building people analytics dashboards or exploring workforce trends.
Hospital Patients Sample Dataset
A healthcare dataset that tracks patient admissions, billing, and insurance details.
The columns are Patient ID, Patient Name, Age, Gender, Admission Date, Discharge Date, Department, Diagnosis, Total Bill Amount, Insurance Coverage %, and Payment Status.
Each row is a patient visit, showing which department they were treated in (Cardiology, Emergency, Orthopedics, etc.), their diagnosis, how long they stayed, and how much of the bill insurance covered. Payment Status tracks whether the bill is Paid, Pending, or Partially Paid.
This data is great for hospital operations analysis: average length of stay by department, billing and revenue insights, insurance coverage patterns, and patient demographic breakdowns. It’s also useful for practicing healthcare KPI dashboards and date-based calculations.
Personal Finance Dataset
A personal budgeting dataset that tracks income, expenses, and account balances over time.
Columns include Transaction ID, Date, Account, Type, Category, Description / Merchant, Amount, Payment Method, Is Recurring, and Running Balance.
Each row is a single financial transaction (salary deposits, rent payments, grocery runs, subscriptions, etc). The Type column separates Income from Expenses, and the Is Recurring flag helps identify fixed monthly costs.
This is perfect for personal finance analysis: monthly spending breakdowns by category, income vs. expense tracking, identifying recurring costs, and visualizing balance trends over time. It’s a fun, relatable dataset for learning budgeting dashboards or practicing SUMIFS and conditional logic.
Social Media Analytics Dataset
This dataset captures post-level social media performance across multiple platforms.
You’ll find Post ID, Platform, Post Date, Content Type, Impressions, Reach, Likes, Comments, Shares, and Engagement Rate %.
Each row represents a single social media post on Facebook, Instagram, Twitter, or LinkedIn, with metrics showing how it performed. Content types include Text, Image, Video, and Carousel posts.
This is ideal for social media performance analysis, comparing engagement rates across platforms, figuring out which content types drive the most interaction, tracking reach and impressions over time, and benchmarking performance. Great for marketing analysts or anyone learning to build social media reporting dashboards.
Student Performance Sample Dataset
An education dataset tracking student grades and attendance across semesters.
Columns include Student ID, Student Name, Gender, Department / Major, Semester, Course Name, Credit Hours, Grade, GPA (Semester), and Attendance %.
Each row represents a student’s record for a specific course in a specific semester. Students appear multiple times across semesters, so you can track academic progress over time. Grades range from A to F, and attendance is captured as a percentage.
This is a great dataset for academic performance analysis: GPA trends across semesters, attendance vs. grade correlations, departmental comparisons, and identifying at-risk students. It also works well for practicing grouped analysis and multi-variable reporting.
Marketing Campaigns Dataset
A marketing dataset that ties campaign spend directly to results.
The columns are Campaign ID, Campaign Name, Channel, Start Date, End Date, Budget Allocated, Amount Spent, Impressions, Clicks, Conversions, and Revenue Generated.
Each row is a single marketing campaign run across channels like Facebook, Instagram, LinkedIn, Google Ads, and Email. You get full funnel data, from impressions and clicks down to conversions and revenue, plus budget vs. actual spend.
This one is perfect for marketing ROI analysis, cost-per-click and cost-per-conversion calculations, channel performance comparisons, and budget utilization tracking. If you want to build a marketing performance dashboard or practice funnel-based metrics, this is a solid pick.
Fitness Tracker Dataset
A health and wellness dataset that logs daily fitness and lifestyle metrics.
Columns include User ID, Date, Workout Type, Workout Duration (Minutes), Calories Burned, Steps Count, Calories Consumed, Sleep Duration (Hours), Sleep Quality, and Weight (kg).
Each row captures one day of a user’s fitness journey (what workout they did, how long it lasted, their calorie burn vs. intake, how well they slept, and their weight). Multiple users are tracked over time, so you can analyze individual trends or compare across users.
This dataset is awesome for health and fitness analysis: tracking weight trends, correlating sleep quality with workout performance, calorie surplus/deficit calculations, and building personal wellness dashboards. It’s also a fun one for practicing time-series charts and goal tracking.
Create Your Own Sample Dataset in Excel
Industry-Wise Sample Data Generator for Excel
Pick an industry, customize columns, and download realistic sample data as an Excel file instantly.
This industry sample data generator gives you sample Excel data for practice in seconds.
Pick an industry, choose how many rows you need, select the columns you want, and download a ready-to-use .xlsx file.
The data looks realistic because it follows the patterns and ranges you’d see in actual business data.
This Excel sample data generator covers 12 industries, from Retail and Healthcare to Project Management and Fitness. Each industry has its own set of columns with data that makes sense in context.
A healthcare dataset won’t have random prices attached to random diagnoses. The charges match the procedures. An HR dataset won’t show a receptionist earning $180,000. The salaries match the job titles.
How to Use This Sample Data Generator
- Step 1: Pick your industry. Select from 12 industries in the dropdown. Each industry has its own set of columns designed for that field.
- Step 2: Set the number of rows. Enter any number from 1 to 500,000. The default is 100, which works well for practice datasets. For example, if you need sample employee data in Excel with 100 rows, just select HR as your industry and hit generate.
- Step 3: Choose your columns. When you select an industry, all its columns appear as checkboxes. They’re all checked by default. Uncheck any columns you don’t need. Use the Select All / Deselect All links to toggle quickly.
- Step 4: Name your file (optional). If you leave this blank, the file will be named after the industry (like “retail-sales-data.xlsx”). Enter a custom name if you prefer something specific.
- Step 5: Click Generate Data. The tool creates your dataset and shows a preview of the first 10 rows. For large datasets (over 10,000 rows), you’ll see a progress bar while it generates.
- Step 6: Download the Excel file. Click the indigo download button to get your .xlsx file. The file has auto-sized columns, and the sheet is named after your industry.
Note: This Excel sample data generator doesn’t store any information, and all the work is done in your browser itself. So it’s 100% safe and secure to use. In fact, once the page loads it doesn’t even need an internet connection to work.
Other Useful Excel Resources:


