
A lot of times we have charts that have to handle empty data cells. Excel gives you the flexibility to decide how the empty cells should be treated.
Suppose I have the data for date-wise sales of a product from a shop. Assuming that the shop is closed on Sunday and national holidays, there are some gaps on these days. 
Handle Data Gaps in Excel Charts
Now if you plot this data in a chart in Excel, there are three options. Show Empty cells as:
- Gap
- Zero
- Connect data points with line
To access this option:
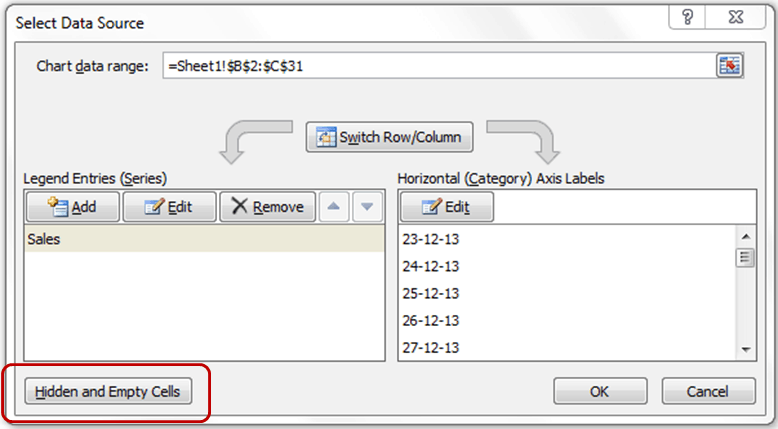
- Select the chart
- Go to Design –> Select Data
- In Select Data Source dialogue box, select Hidden and Empty Cells option (which is at the bottom-left)
- Select the appropriate option
Depending on the type of graph, it is helpful to know what excel does to empty cells. Here are the examples on how your charts would look:
#1 Show Empty cells as Gap

This option could be helpful either in bar charts, or in scenarios where you want the gaps to be highlighted.
#2 Show Empty cells as Zero

This looks like a complete misrepresentation of data. This option is best avoided in line charts. This could be used in column charts
#3 Show Empty cells as Connect Data Points with Line

This seems to be the best alternative among the three. Based on the ongoing trend, it does not disrupt the flow of the chart. However, you should be careful not to use it when the gap is huge (for example if the data is missing for 4-5 consecutive days)
You May Also Like the Following Excel Tutorials:


