

If you use Power Query and Pivot Tables (or Power BI), you have probably hit this question: should I do this calculation in Power Query or in DAX?
And this is confusing because both tools can add columns and do calculations, so it often feels like either one would work.
But nothing to worry about. There is a simple way to decide, and in this article I’ll show you exactly what each tool is for, when to use which one, and the rule of thumb I use myself.
Power Query vs DAX: The Short Answer
Here is the one-line version: Power Query prepares your data, and DAX analyzes it.
Power Query runs before your data lands in the workbook or the data model. It connects to sources, cleans messy data, and reshapes tables. It does all this once, every time you refresh.
DAX runs after the data has loaded. It calculates results such as totals and percentages, and those results recalculate on the fly as you filter or slice your Pivot Table or report.
So the quick decision looks like this:
If that already answers your question, great. If you want to actually understand the why (so you never have to look this up again), keep reading.
What is Power Query?
Power Query is the data preparation tool built into Excel and Power BI. In Excel, you’ll find it on the Data tab in the Get & Transform Data group.
Think of it as a smart import wizard. You connect to a source (an Excel file, a folder of CSVs, a database, a web page), and then apply transformation steps such as removing columns, filtering rows, splitting text, or merging tables.
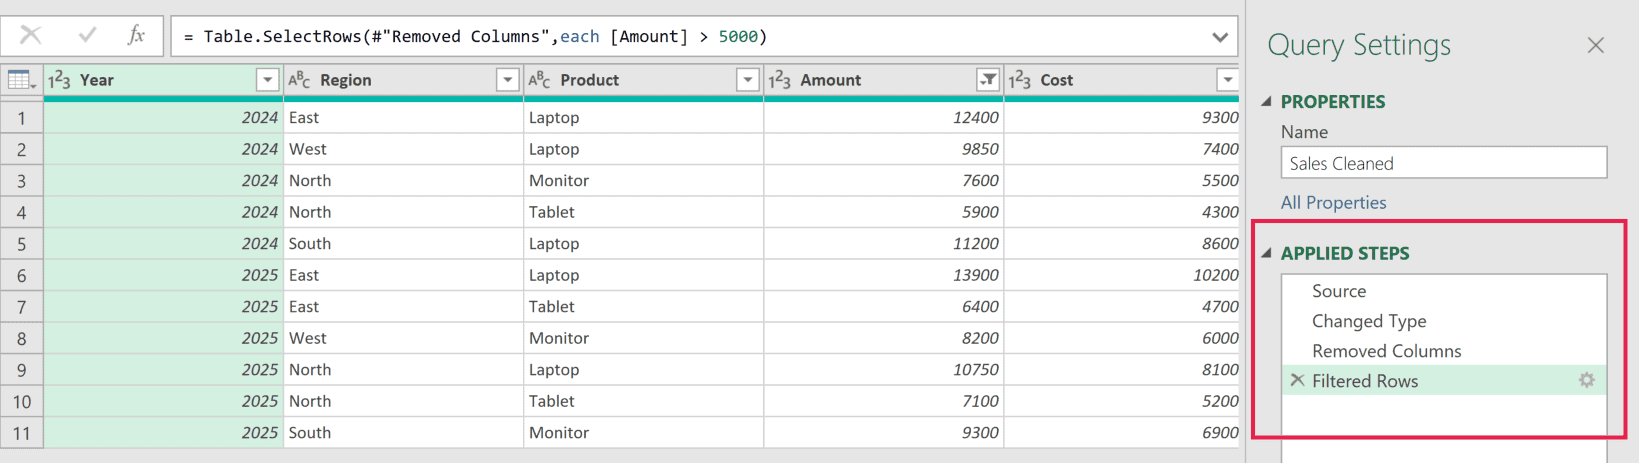
Every step you take is recorded in the Applied Steps list. The next time your source data changes, you click Refresh and Power Query replays all those steps on the new data automatically.
Behind the scenes, each step writes a line of code in a language called M. You rarely need to write M yourself though. Most transformations are just clicks in the Power Query editor.
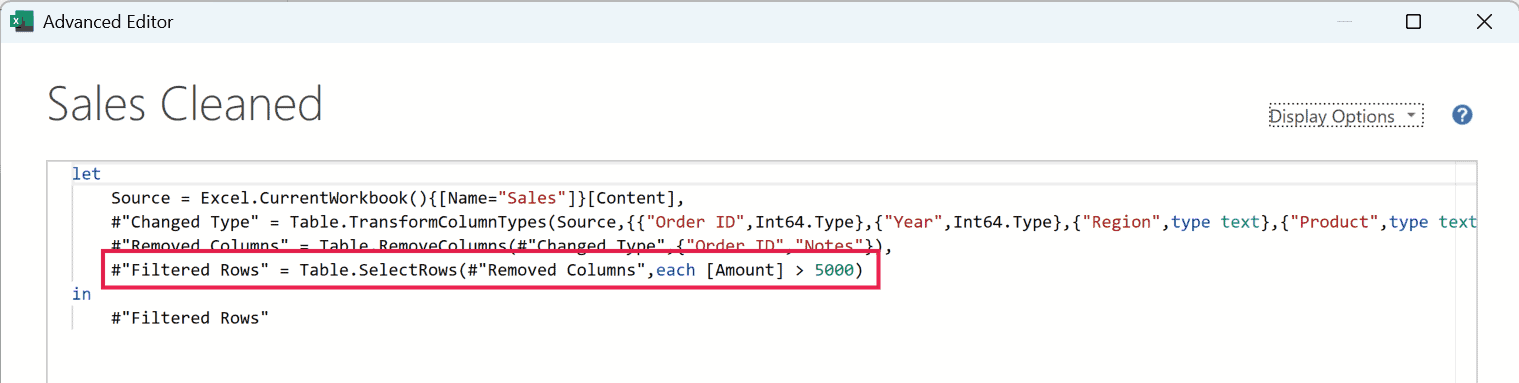
The key thing to remember: Power Query changes the shape and content of your data before anyone analyzes it. Its work is done at refresh time.
If you’re new to it, I have a detailed guide on what Power Query is and how to use it, and a free Power Query course as well.
What is DAX?
DAX (short for Data Analysis Expressions) is the formula language used in Power Pivot in Excel, and in Power BI.
If you have written Excel formulas, DAX will look familiar. It has functions such as SUM, COUNT, and IF. The big difference is that DAX formulas work on entire tables and columns, not on individual cells.
In Excel, DAX lives inside the Data Model (the in-memory database behind Power Pivot). You use it in two places:
- Calculated columns, which add a new column to a table in the Data Model. The formula is applied to every row.
- Measures, which are calculations such as Total Sales or Profit Margin that you drop into the Values area of a Pivot Table.
![Power Pivot formula bar showing the DAX expression =[Amount]-[Cost] to calculate values in the Profit column](https://trumpexcel.com/wp-content/uploads/2026/08/Profit-column-created-within-Power-Pivot-using-DAX.png)
Here is a simple DAX measure that adds up everything in the Amount column of a Sales table:
Total Sales:=SUM(Sales[Amount])
The magic of a measure is that it is not one fixed number. Put it in a Pivot Table with regions in the rows, and it shows the total for each region. Add a slicer for the year, and every number updates instantly.
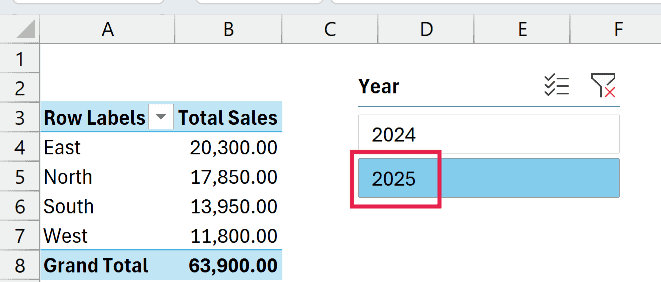
That is DAX’s whole job: calculating answers that adapt to whatever the person looking at the report has filtered or selected.
Note that DAX is available in Excel 2016 and later versions (through Power Pivot), and in all versions of Power BI.
One catch: even though Power Pivot ships with Excel, its tab is often hidden by default. If you don’t see it in the ribbon, you’ll need to enable it first (I cover how a little later in this article).
Where Each One Fits in the Data Journey
The easiest way to keep the two tools straight is to see where each one sits in the journey your data takes.
Power Query works upstream, before the analysis. DAX works downstream, during the analysis.
They are not competitors. They are two stations on the same assembly line.
This is also why the timing matters so much. Power Query results are baked in until the next refresh. DAX results recalculate every time someone clicks a slicer.
Power Query vs DAX: Side-by-Side Comparison
Here is a full comparison of the two tools:
| Power Query | DAX | |
|---|---|---|
| Main job | Import, clean, and reshape data | Calculate results from loaded data |
| When it runs | At refresh time | As you interact with the Pivot Table or report |
| Language | M | DAX |
| Where you use it | Power Query editor (Data tab in Excel) | Power Pivot in Excel, Power BI |
| Output | Tables (to a worksheet or the Data Model) | Measures and calculated columns |
| Aware of filters and slicers? | No | Yes |
| Feels like | A recorded macro for data cleanup | Excel formulas that work on whole tables |
| Typical tasks | Combine files, split columns, unpivot, remove duplicates | Totals, percentages, year-to-date, comparisons |
| Coding needed? | Rarely (the editor writes M for you) | Yes, you write the formulas |
One thing this table makes obvious: the “Aware of filters and slicers?” row is the real dividing line. Everything else follows from it.
When Should You Use Power Query, and When DAX?
Now let’s turn that into practice. Here is the same decision, split by the kind of task in front of you.
Use Power Query When the Data Itself Is the Problem
Reach for Power Query whenever the data needs fixing or reshaping. Some examples:
- Combining data from multiple files, sheets, or a whole folder into one table
- Cleaning messy data, such as removing extra spaces, fixing dates stored as text, or deleting error rows
- Splitting or merging columns, like separating full names into first and last name
- Unpivoting, where you convert a wide month-by-month layout into a proper tabular format
- Removing duplicates or filtering out rows you never want to analyze
- Merging two tables based on a common column, similar to what you’d do with XLOOKUP
Notice the pattern. None of these depend on what the viewer filters later. A misspelled city name is wrong for everyone, in every view. So you fix it once, upstream, in Power Query.
Here is what a simple custom column looks like in Power Query, calculating profit for each row:
= [Amount] - [Cost]
![Power Query Custom Column dialog box showing the formula = [Amount] - [Cost] highlighted in a red box](https://trumpexcel.com/wp-content/uploads/2026/08/Custom-column-formula-dialog-box-in-Power-Query.png)
Power Query computes this for every row at refresh and stores the result like any other column.
Use DAX When the Answer Depends on the Selection
Reach for DAX whenever the result should change based on how the data is filtered. Some examples:
- Totals and averages that respond to slicers, like Total Sales for whatever year is selected
- Percentages of a total, such as each region’s share of overall sales
- Time intelligence, like year-to-date totals, running totals, or comparing this month vs the same month last year
- Ratios across tables, like dividing sales from one table by targets from another
- Distinct counts, such as the number of unique customers in the current selection
Take “each region’s share of total sales” as an example. The percentage for the East region depends on which years, products, or channels the viewer has selected. There is no single fixed answer you could precompute in Power Query.
Here is that measure in DAX:
Sales %:=DIVIDE(SUM(Sales[Amount]),CALCULATE(SUM(Sales[Amount]),ALL(Sales)))
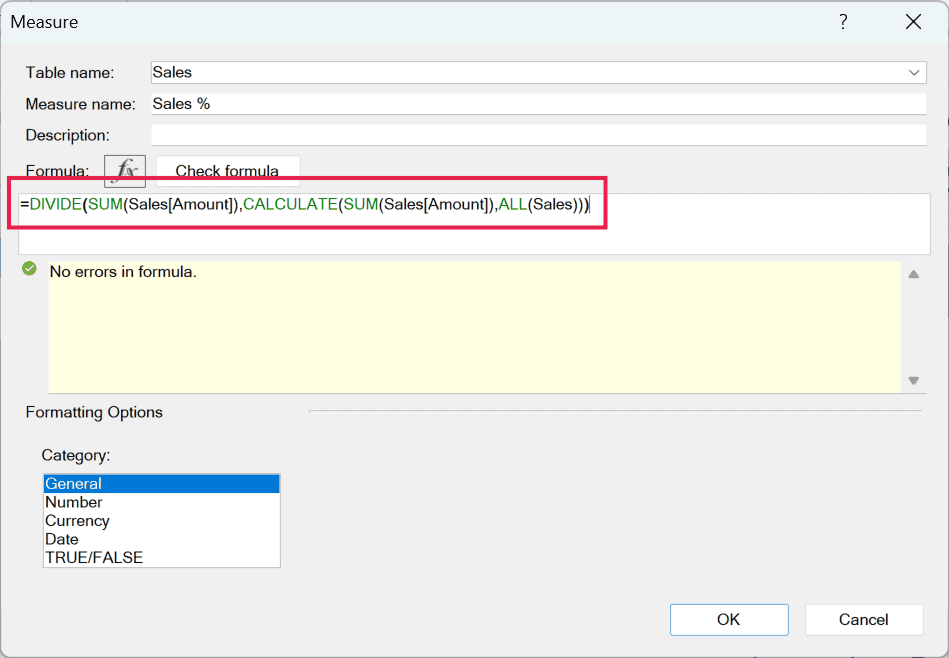
The DIVIDE part handles the division safely, and the CALCULATE with ALL part gets the grand total by ignoring the filters. This formula re-evaluates every time the selection changes.
Same Calculation, Two Different Answers
Here is where the confusion usually comes from. Some calculations can be done in either tool, and Profit is the classic example.
You can add a Profit column in Power Query (Sales minus Cost, stored per row). Or you can write a Profit measure in DAX. Both show the same total in your Pivot Table. So which is right?
For a simple row-by-row value that never changes meaning, I’d do it in Power Query. It is computed once at refresh, it doesn’t make your Pivot Table work harder, and you can see the result right there in the table.
But the moment you need Profit Margin, the answer flips. Margin is Profit divided by Sales, and here is the trap: you cannot sum up row-level margins. The margin for the whole East region is total profit divided by total sales, not the sum of each row’s margin.
A margin column in Power Query would give you a number that is wrong the moment it is aggregated. A DAX measure gets it right at every level automatically:
Profit Margin:=DIVIDE(SUM(Sales[Profit]),SUM(Sales[Amount]))
That is the finer version of the rule. Row-level facts belong in Power Query. Aggregation-level answers belong in DAX.
Which One Should You Use? (Interactive Decision Helper)
Below is a quick interactive helper. Click the task that matches what you’re trying to do, and it will tell you which tool to use and why.
If your task isn't listed, run it through the two questions from the start of this article. Does it change the data itself? Power Query. Does the answer depend on the current filters? DAX.
Power Query vs Power Pivot vs M vs DAX: Clearing Up the Names
Microsoft did not make the naming easy here, so let me untangle the four terms you keep seeing together:
| Term | What it actually is |
|---|---|
| Power Query | The data preparation tool (the Get & Transform Data group in the Excel ribbon) |
| M | The language Power Query writes behind the scenes |
| Power Pivot | The Excel add-in that manages the Data Model (tables and relationships) |
| DAX | The formula language you use inside Power Pivot and Power BI |
So "Power Query vs Power Pivot" is really the same question as "Power Query vs DAX." Power Query prepares the data, and Power Pivot (using DAX) analyzes it.
M and DAX are completely different languages, by the way. M is case-sensitive and looks nothing like Excel formulas. DAX deliberately mimics Excel functions.
Knowing one does not mean you know the other, and that's fine. Most people click their way through Power Query and only ever write DAX.
There is also a setup difference between the two. Power Query needs no setup at all. It's built into Excel 2016 and later versions, right there in the Data tab (in the Get & Transform Data group).
Power Pivot ships with Excel too, but its tab stays hidden until you enable it. To do that, go to File > Options > Add-ins, select COM Add-ins in the Manage drop-down, click Go, and check Microsoft Power Pivot for Excel.
Clicking Data > Manage Data Model once also turns it on. And if you use Excel on a Mac, note that Power Pivot is not available there at all.
In Power BI, both tools are built in from the start.
A Simple Rule of Thumb
There is a well-known principle among Power BI folks called Roche's maxim, and it is worth stealing for Excel too. Transform your data as far upstream as possible, and as far downstream as necessary.
In plain English: if a calculation can be done in Power Query, do it there. Only push work down to DAX when it genuinely needs to react to filters and selections.
Why? Because Power Query does its work once, at refresh. DAX does its work every single time someone clicks. The less DAX has to compute live, the faster your Pivot Tables and reports feel.
My practical version of the rule:
- Fixing, shaping, or combining data? Power Query, always.
- A value that is true for one row, forever? Power Query.
- A number that must adapt to the viewer's selection? DAX.
- A ratio or percentage that gets aggregated? DAX, so it stays correct at every level.
Things to Keep in Mind
- Power Query results are static between refreshes. If the source data changes, your tables and DAX results only update after you refresh the query.
- Calculated columns in DAX are usually the wrong default. If a column doesn't need the Data Model's filter logic, build it in Power Query instead. It keeps your model smaller and faster.
- You can't sum ratios. Percentages, margins, and averages computed per row give wrong totals when aggregated. These always belong in a DAX measure.
- DAX in Excel needs the Data Model. Regular Pivot Tables from a worksheet range can't use DAX measures. Load your data to the Data Model (there's a checkbox for this when creating a Pivot Table or loading from Power Query).
- Power Pivot is Windows-only. Excel for Mac supports Power Query, but there is no Power Pivot on Mac, so you can't create DAX measures there.
- Power Query is not aware of your slicers. You cannot use Power Query to build anything that reacts to what a viewer selects in the report.
- Learn Power Query first. If you're starting from scratch, Power Query pays off immediately with zero coding. DAX is worth learning next, starting with simple measures like SUM and DIVIDE.
In this article, I covered what Power Query and DAX are each built for, how to decide between them, and the rule of thumb that makes the choice automatic. I hope you found this article helpful.
Other Excel Articles You May Also Like:
