

The FORECAST.ETS.CONFINT function in Excel tells you how far a forecast could be off. It returns a margin, a plus-or-minus amount that you subtract from and add to the forecast from the FORECAST.ETS function to get a likely low and high value.
A forecast on its own is one number, and the real result almost never lands exactly on it. The margin turns that single guess into a range, and by default the range is wide enough that 95% of real results should fall inside it.
In this article, I’ll show you how to get the margin for one month, build a low and high range for several months, change the confidence level, keep seasonal forecasts in sync, and handle logs with more than one entry per date.
Follow along with the example file
FORECAST.ETS.CONFINT Function Examples.xlsx
FORECAST.ETS.CONFINT Function Syntax
Here is the syntax of the FORECAST.ETS.CONFINT function:
=FORECAST.ETS.CONFINT(target_date, values, timeline, [confidence_level], [seasonality], [data_completion], [aggregation])
- target_date – The date (or period number) you want the margin for. It has to come after the last date in your timeline.
- values – The historical numbers the forecast is based on.
- timeline – The dates (or period numbers) that go with those values.
- [confidence_level] – Optional. How sure you want to be that the real number lands inside the range, as a value between 0 and 1. The default is 0.95 (95%).
- [seasonality] – Optional. The length of the repeating pattern. Leave it out (or use 1) and Excel finds the pattern on its own, use 0 for no pattern, or enter a whole number such as 4 or 12.
- [data_completion] – Optional. What to do with missing points, such as a blank value or a skipped month in an otherwise regular timeline. Leave it out (or use 1) to fill each one with the average of its neighbors, or use 0 to treat them as zero.
- [aggregation] – Optional. How to combine values that share the same date. Leave it out (or use 1) to average them. The other options are 2 (COUNT), 3 (COUNTA), 4 (MAX), 5 (MEDIAN), 6 (MIN), and 7 (SUM).
You can enter the confidence level as a decimal (0.9) or as a percentage (90%). A whole number like 90 (or 1) returns the #NUM! error, because the level has to be more than 0 and less than 1.
If you point target_date at a date that is already in your timeline (even the last one), you get the #NUM! error. The function only works out margins for dates after your history ends.
The timeline also needs a regular step between its dates, such as one week, one month, or one quarter. If Excel can’t find a regular step, the function returns #NUM!, and if the values and timeline ranges are different sizes, it returns #N/A.
The last three arguments work exactly like they do in the FORECAST.ETS function. They just sit one spot later, since confidence_level takes the fourth spot.
The FORECAST.ETS.CONFINT function works in Excel 2016 and later on Windows and Mac, including Microsoft 365, 2024, 2021, and 2019. It is not available in Excel for the web or in the Excel mobile apps.
When to Use the FORECAST.ETS.CONFINT Function
Use this function when you need to:
- Show how much a forecast could be off, instead of sharing one exact number
- Get a low and a high value around each forecast
- Plan for a best case and a worst case, like stocking enough for a busy month
- Compare how reliable two forecasts are
- Check whether a new actual number falls within the expected range
Let me show you a few practical examples of how to use the FORECAST.ETS.CONFINT function in Excel.
Example 1: Get the Forecast Margin for Next Month
Let’s start with a simple example.
Below I have the online orders a small candle shop got each month from October 2025 to September 2026, and I want to forecast the orders for October 2026 in cell E2 and get its margin in cell F2.
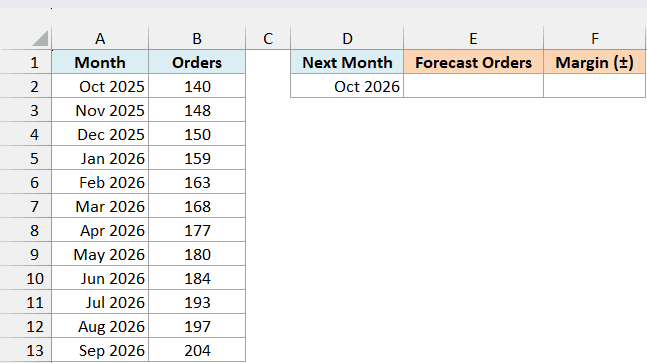
First, here is the forecast formula:
=FORECAST.ETS(D2,B2:B13,A2:A13)
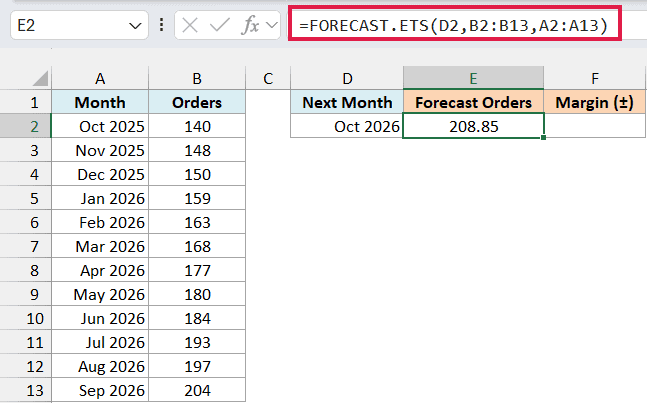
D2 has the month I want a forecast for (target_date), B2:B13 has the orders (values), and A2:A13 has the months they belong to (timeline).
The formula forecasts 208.85 orders for October 2026, which continues the steady climb from 140 orders in October 2025 to 204 in September 2026.
Now, here is the formula for the margin:
=FORECAST.ETS.CONFINT(D2,B2:B13,A2:A13)
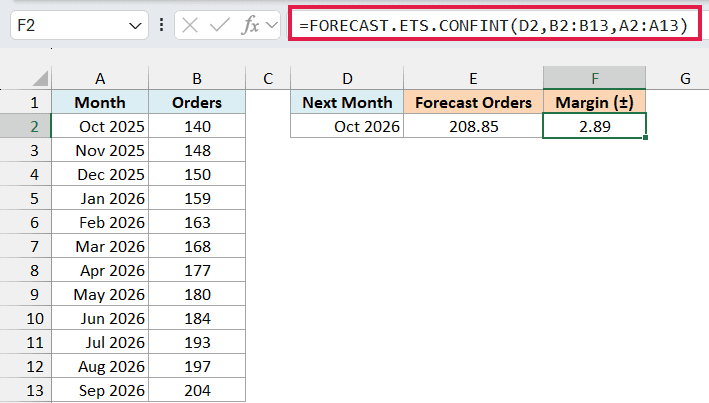
The formula takes the same three arguments as the forecast and returns 2.89. That means the October orders are likely to land within 2.89 of the forecast, so somewhere between 205.96 and 211.75.
Since I left out the confidence level, Excel uses 95%. In other words, if this pattern holds, the real number should fall inside that range 95 times out of 100.
The margin here is small because the orders grew at an almost even pace every month. The more your history jumps around, the bigger the margin gets, as you’ll see in Example 5.
Example 2: Forecast Upper and Lower Bounds for Several Months
Now let’s build a complete forecast range for several months with spilling formulas.
Below I have the monthly downloads of a budgeting app from April 2025 to September 2026, and I want to forecast the next six months in column E, get the margin in column F, and the low and high values in columns G and H.
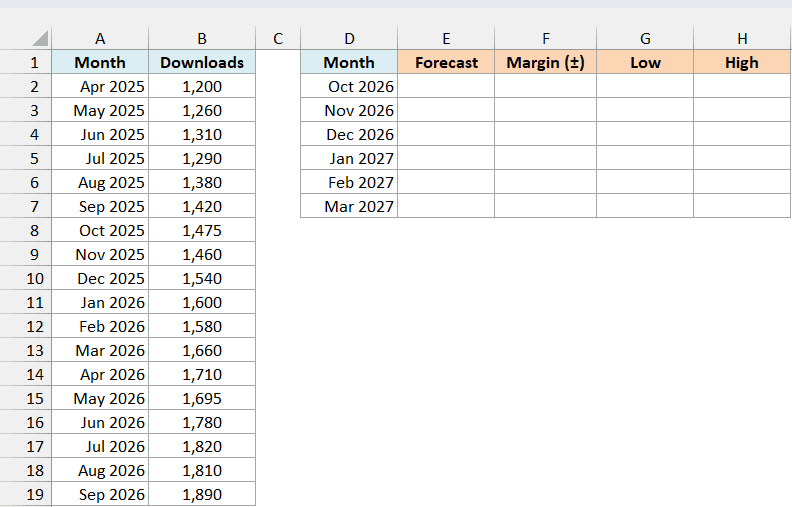
First, here is the forecast formula:
=FORECAST.ETS(D2:D7,B2:B19,A2:A19)
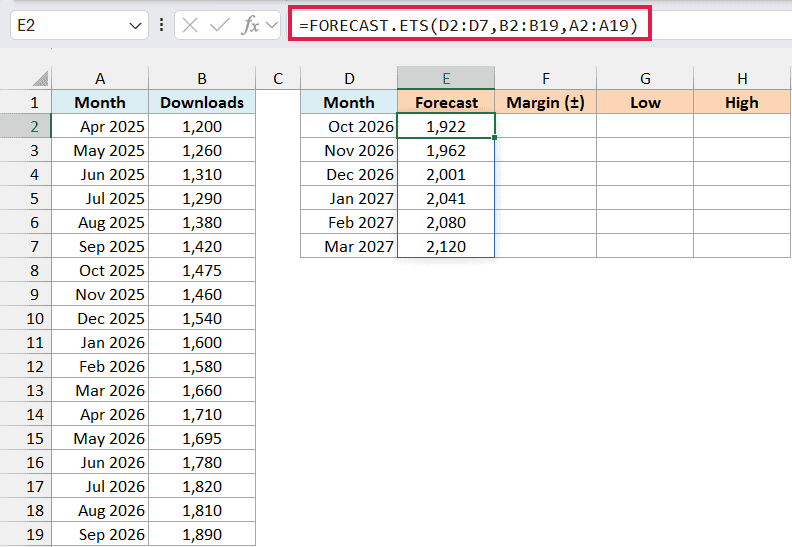
Since the target_date argument is the range D2:D7, the formula returns a forecast for each of the six months and spills the results into E2:E7. The forecasts go from 1,922 downloads in October 2026 to 2,120 in March 2027.
Next, here is the formula for the margin:
=FORECAST.ETS.CONFINT(D2:D7,B2:B19,A2:A19)
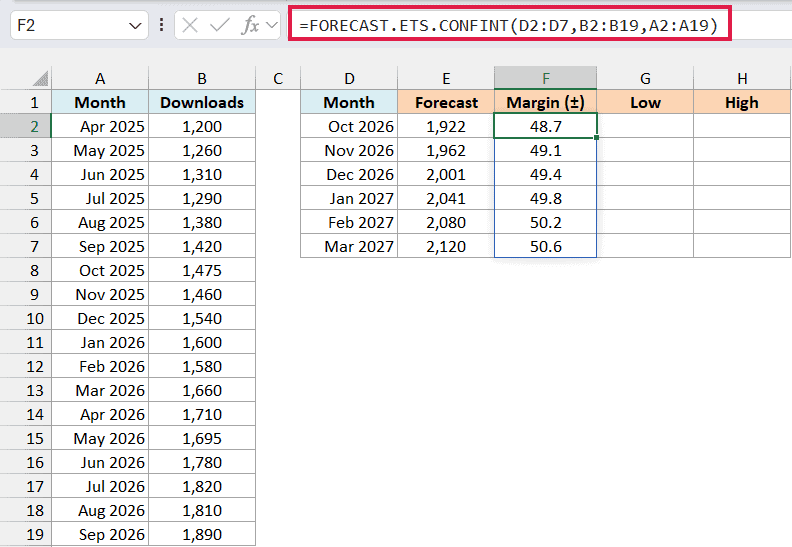
This also spills, giving one margin for each month. Notice that the margin grows from 48.7 in October to 50.6 in March, because Excel is less sure about months that are further away.
Now, here is the formula for the low end of the range:
=E2#-F2#
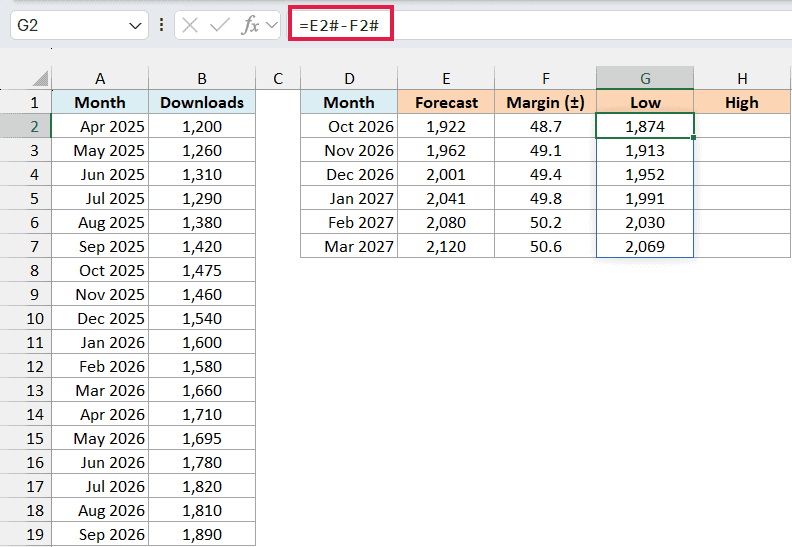
The # after E2 and F2 refers to the whole spilled range in each column. So this one formula subtracts each margin from its forecast and spills six low values, starting at 1,874.
And here is the formula for the high end:
=E2#+F2#
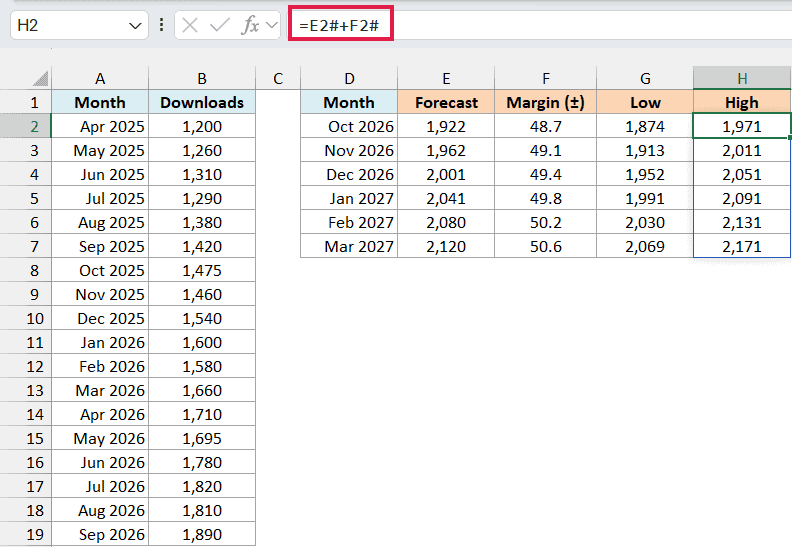
This adds the margin to each forecast instead. So for October 2026, the app should get somewhere between 1,874 and 1,971 downloads.
Pro Tip: To forecast more months, add the dates below D7 and change D2:D7 in the first two formulas. The low and high formulas grow on their own, as long as the cells below are empty (otherwise you get a #SPILL! error).
Spilling formulas need Excel 2021 or Microsoft 365. If you are using Excel 2019 or 2016, enter the below formula in cell F2 and then copy it down to F7:
=FORECAST.ETS.CONFINT(D2,$B$2:$B$19,$A$2:$A$19)
The forecast in column E works the same way, and the low and high values become a simple subtraction and addition in each row. You can use this per-row approach for every spilling formula in this article.
Example 3: Change the Confidence Level
Here’s a scenario where you want to see how the confidence level changes the range.
Below I have the smoothies a juice bar sold each week from July 6 to September 21, 2026, and I want to get the margin for the week of September 28 at four different confidence levels in column E.
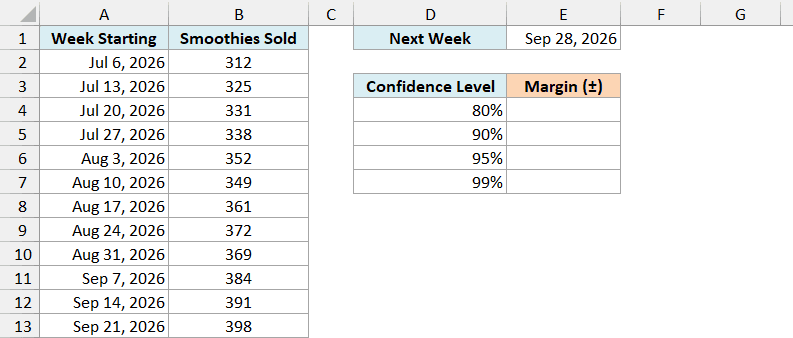
Here is the formula:
=FORECAST.ETS.CONFINT(E1,B2:B13,A2:A13,D4:D7)
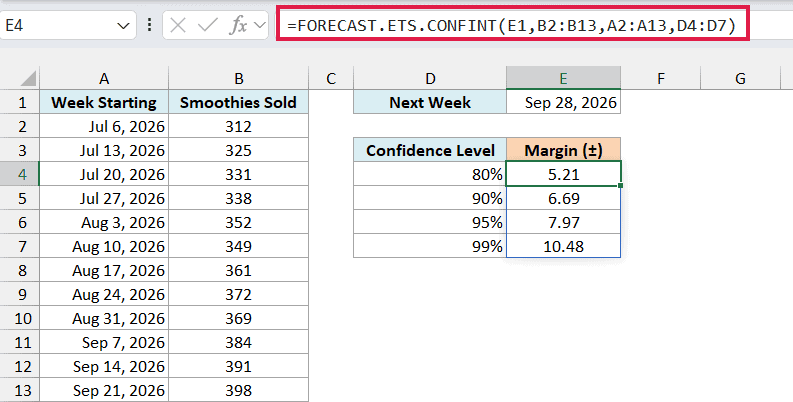
E1 has the week I want the margin for, and D4:D7 goes in the confidence_level argument. Since I gave it four levels, the formula spills four margins, from 5.21 smoothies at 80% up to 10.48 at 99%.
The higher the confidence level, the wider the margin. To be 99% sure the real number falls inside the range, the range has to stretch further than it does at 80%.
So the level you pick is a trade-off. A 95% level (the default) is a common middle ground, while 80% gives you a tighter range that the real number will miss more often.
If you are using Excel 2019 or 2016, enter the below formula in cell E4 and then copy it down to E7:
=FORECAST.ETS.CONFINT($E$1,$B$2:$B$13,$A$2:$A$13,D4)
Example 4: Use FORECAST.ETS.CONFINT with Seasonal Data
This next one is about data that follows a pattern, and a mistake that is easy to make with it.
Below I have the quarterly sales of an ice cream shop from 2023 to 2025, and I want to forecast the four quarters of 2026 in column E and get the margin for each in column F.
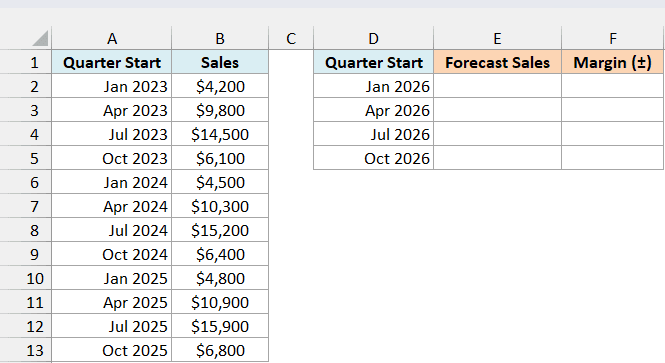
Sales are low in the January quarter, peak in July, and drop again in October, every year. Since that cycle repeats every four quarters, I’ll set the seasonality to 4 in both formulas.
First, here is the forecast formula:
=FORECAST.ETS(D2:D5,B2:B13,A2:A13,4)
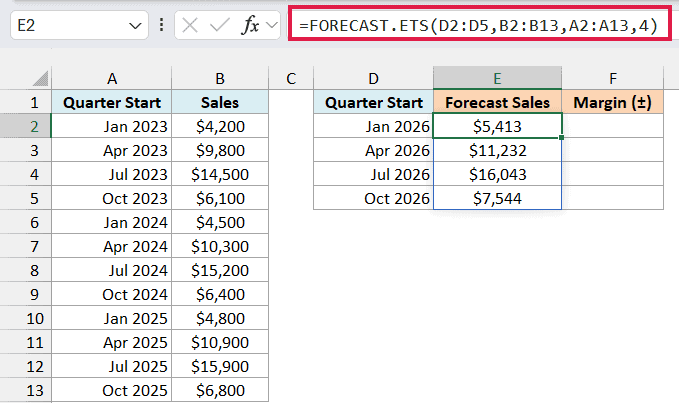
The 4 in the fourth spot is the seasonality, so the forecasts follow the same yearly shape, from $5,413 in the January quarter up to $16,043 in July.
Excel would find this four-quarter cycle on its own here, so leaving the seasonality out gives the same results. Typing the 4 just locks in the cycle you know is there instead of relying on the automatic check, and you put the same 4 in both formulas.
Now, here is the formula for the margin:
=FORECAST.ETS.CONFINT(D2:D5,B2:B13,A2:A13,,4)
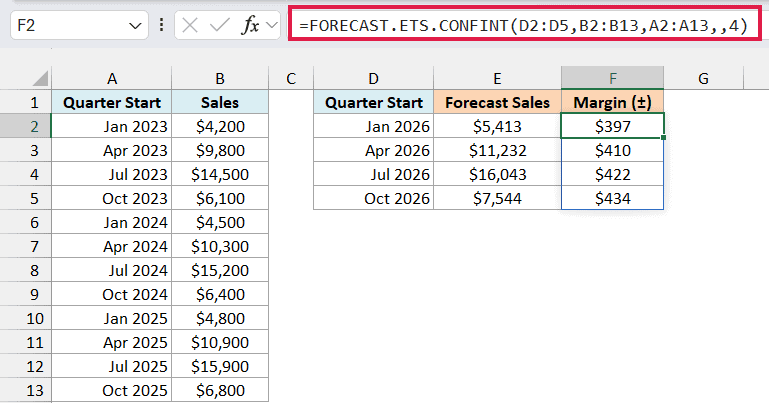
Here the 4 sits in the fifth spot, because the fourth spot is the confidence level. I left that spot empty (the two commas), so Excel still uses 95%, and the margins come out between $397 and $434.
Important: If you copy the forecast formula and only change its name, the 4 lands in the confidence_level spot and you get the #NUM! error. Always move seasonality, data_completion, and aggregation one spot to the right in FORECAST.ETS.CONFINT.
Use the same optional settings in both functions, too. The margin is only meaningful for the forecast it was built for.
For example, if the margin formula used 0 (no seasonality) here, it would measure a forecast that ignores the yearly cycle. That margin comes out at around $9,465 for the January quarter, more than 20 times the $397 that matches our forecast.
Example 5: Show the Margin as a Percentage
A margin of 50 can be tiny or huge, depending on the size of the forecast. Showing it as a percentage makes it easier to read.
Below I have a freelancer’s monthly income from October 2025 to September 2026, and I want to forecast the income for October 2026 in cell E2 and show its margin as a percentage of that forecast in cell F2.
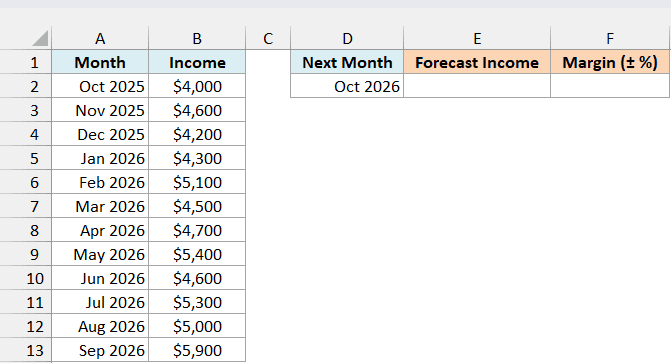
First, here is the forecast formula:
=FORECAST.ETS(D2,B2:B13,A2:A13)
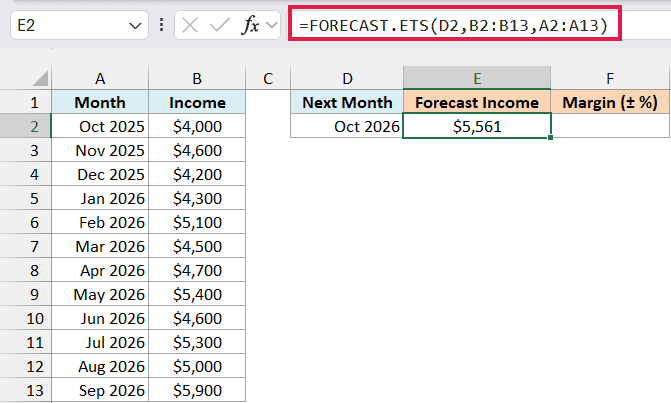
This forecasts an income of $5,561 for October 2026.
Now, here is the formula that gives the margin as a percentage:
=FORECAST.ETS.CONFINT(D2,B2:B13,A2:A13)/E2
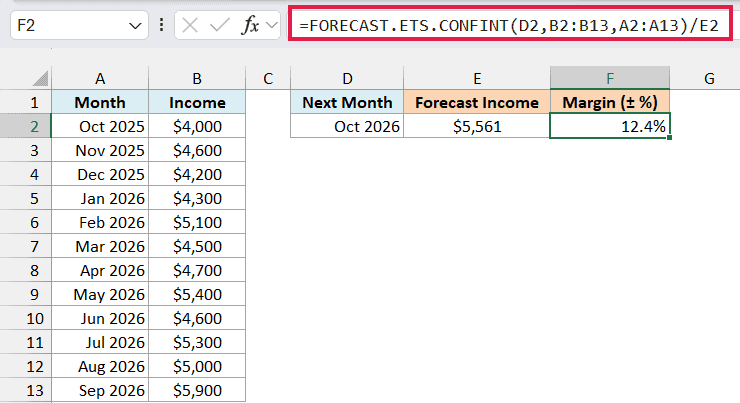
The formula divides the margin (about $688) by the forecast in E2 and returns 12.4%, since F2 is formatted as a percentage. So the freelancer can plan for October income of around $5,561, give or take 12.4%.
That’s a lot wider than the candle shop’s orders in Example 1, where the margin was about 1.4% of the forecast. The income goes up and down from month to month, so Excel is less sure about the next one.
A percentage also lets you compare forecasts that are on very different scales, like the income of two freelancers or the sales of two products.
Example 6: Get the Margin for Daily Totals When Dates Repeat
Let’s end with a log that has more than one entry for the same date.
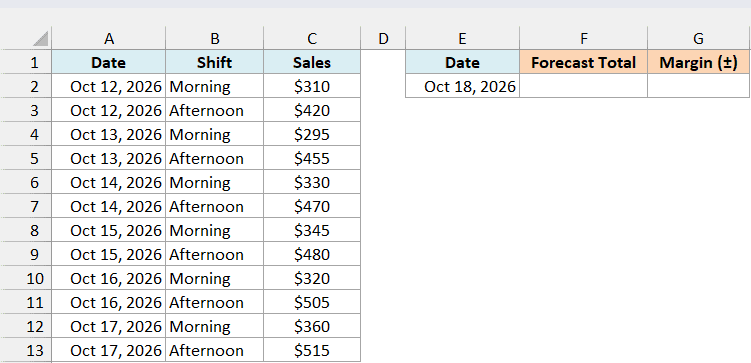
Below I have a bakery’s sales log for October 12 to 17, 2026, with a morning and an afternoon row for each day, and I want to forecast the total sales for October 18 in cell F2 and its margin in G2.
First, here is the forecast formula:
=FORECAST.ETS(E2,C2:C13,A2:A13,,,7)
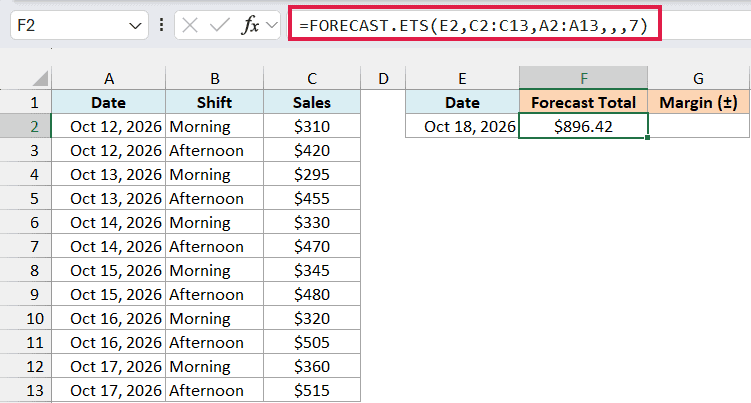
Here E2 has the date to forecast, C2:C13 has the sales, and A2:A13 has the dates.
The 7 in the aggregation argument tells Excel to add up the sales that share a date, so it works with one total per day. The forecast for October 18 is $896.42.
Now, here is the formula for the margin:
=FORECAST.ETS.CONFINT(E2,C2:C13,A2:A13,,,,7)
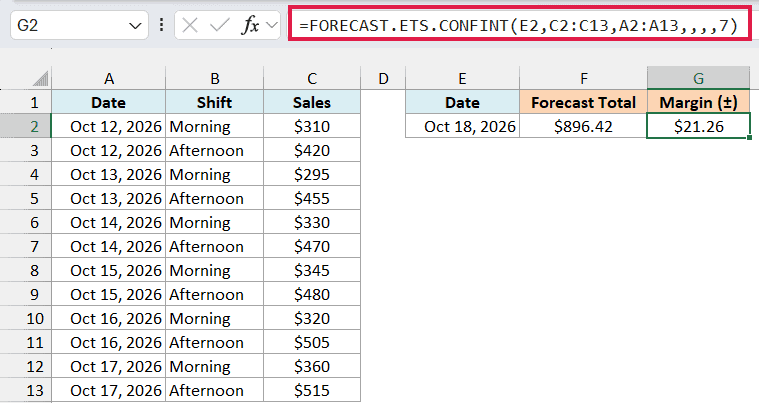
This gives a margin of $21.26, so the bakery can expect between $875.16 and $917.68 in sales on October 18.
Notice that this formula has one more comma than the forecast formula. Just like in Example 4, every optional argument after confidence_level moves one spot to the right, so the 7 goes in the seventh spot here.
Important: If you leave out the aggregation argument, Excel averages the values that share a date. Here that gives a margin of $10.63 around an average shift, not the whole day, so set aggregation to 7 in both formulas for daily totals.
In this article, I showed you how to use the FORECAST.ETS.CONFINT function to get the margin around a forecast, build low and high values for several periods, change the confidence level, and keep the settings in sync with the FORECAST.ETS function.
If you want Excel to build the forecast, the range, and a chart for you, the Forecast Sheet feature (Data tab) does that using these same functions.
I hope you found this article helpful.
Other Excel Articles You May Also Like:
