
If you have a sample of data and you want to estimate the average for the whole group it came from, a single average number doesn’t tell the full story. You also want to know how much that average might be off.
That’s what a confidence interval gives you. It’s a range around your sample average that likely contains the true average of the entire group.
I’ll show you two ways to do it in Excel: a quick formula, and Excel’s Data Analysis ToolPak if you’d rather not write any formulas at all.
What a Confidence Interval Actually Tells You
Let’s say you check 15 recent customer orders and the average order value comes out to $54.80.
That $54.80 is just from your sample. If you looked at every single order your store has ever had, the real average would probably be close to $54.80, but not exactly that.
A confidence interval wraps a range around your sample average. For example, you might end up saying: “I’m 95% confident the true average order value is between $52.30 and $57.30.”
The 95% part is your confidence level. It means if you repeated this sampling many times, about 95% of those intervals would contain the real average. Most people stick with 95%, so that’s what I’ll use here.
Method 1: Calculate a Confidence Interval Using a Formula
Let’s start with the formula method.
You only need a couple of Excel’s built-in functions, and the whole thing comes together in two stages
- First you pull three calculated values from your data, then
- Turn those values into the confidence interval
Get the Three Building Blocks: Mean, Standard Deviation, and Count
Every confidence interval is built from three numbers you pull straight from your data: the mean, the standard deviation, and the count.
Below is the dataset. It has 15 customer order values in cells A2:A16, and I want to estimate the true average order value for all my customers based on this sample.
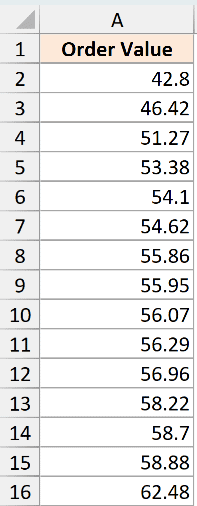
I’ll keep the results tidy by building a small table next to the data. Each result goes in column D, with a label beside it in column C.
That means the mean in D2, the standard deviation in D3, and the count in D4. Every formula later on points back to these cells.
The first number is the sample mean, which is just the average of all the order values:
=AVERAGE(A2:A16)
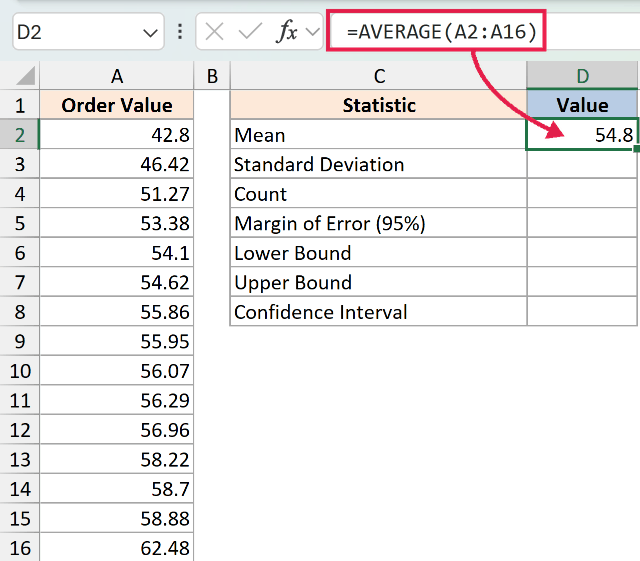
For my data, this returns 54.8. That’s the center of our interval.
The second number is the sample standard deviation. This measures how spread out the order values are. The more spread out they are, the wider our interval will be.
=STDEV.S(A2:A16)
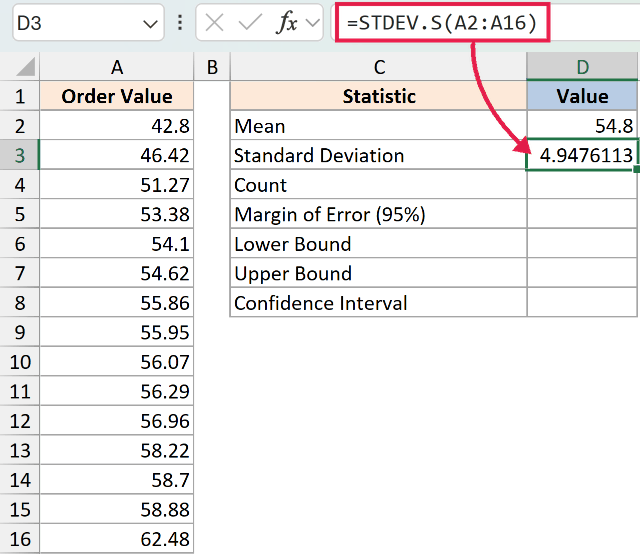
I’m using STDEV.S here (the S stands for sample) because our 15 orders are a sample, not every order ever placed. For my data, this comes out to about 4.95.
The last number is the count, which is simply how many values are in the sample.
=COUNT(A2:A16)
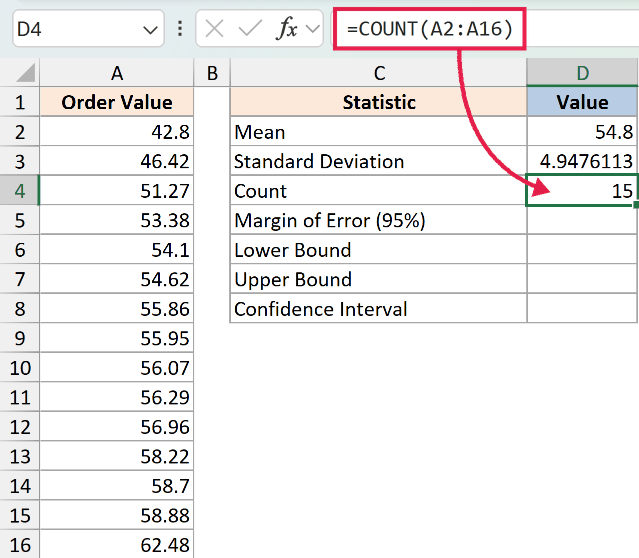
This returns 15. Now we have our three building blocks in place: the mean in D2, the standard deviation in D3, and the count in D4.
Find the Margin of Error and Build the Interval
With those three numbers ready, the interval comes together in two short steps.
Finding Margin of Error
First we work out the margin of error, then we add it to and subtract it from the mean to get the range.
The margin of error is the amount you stretch out on each side of the mean. Excel has a dedicated function for it called CONFIDENCE.NORM.
The syntax is
=CONFIDENCE.NORM(alpha, standard_dev, size)
and here’s what each part means.
- alpha is where most people slip up. It is not your confidence level. It’s 1 minus your confidence level. So for a 95% confidence level, alpha is 0.05 (because 1 − 0.95 = 0.05).
- standard_dev is your standard deviation (D3) and
- size is your sample count (D4).
I’ll put the margin of error formula in cell D5:
=CONFIDENCE.NORM(0.05, D3, D4)
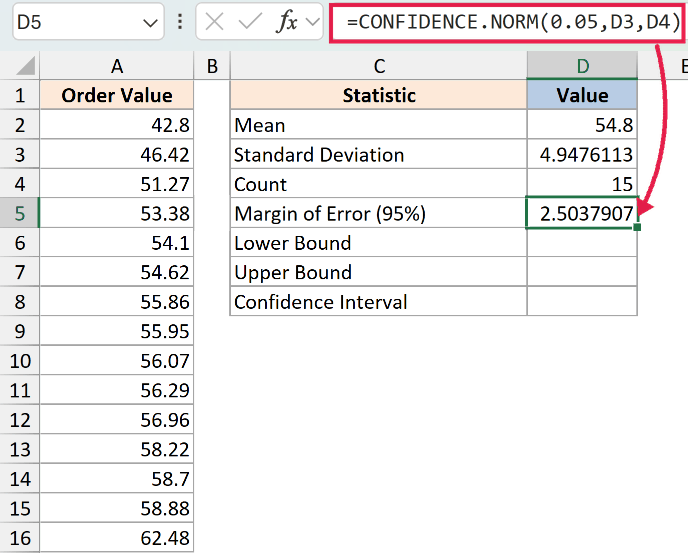
How does this formula work?
The function takes the alpha (0.05 for 95% confidence), looks at how spread out the data is, and factors in the sample size to figure out how far the true average could reasonably be from your sample average.
For my data, this returns about 2.50. That’s our margin of error. A bigger spread or a smaller sample would push this number up and give you a wider, less precise interval.
Now we build the two ends of the range. The lower bound is the mean minus the margin of error. With the mean in D2 and the margin in D5, I’ll put this in D6:
=D2-D5
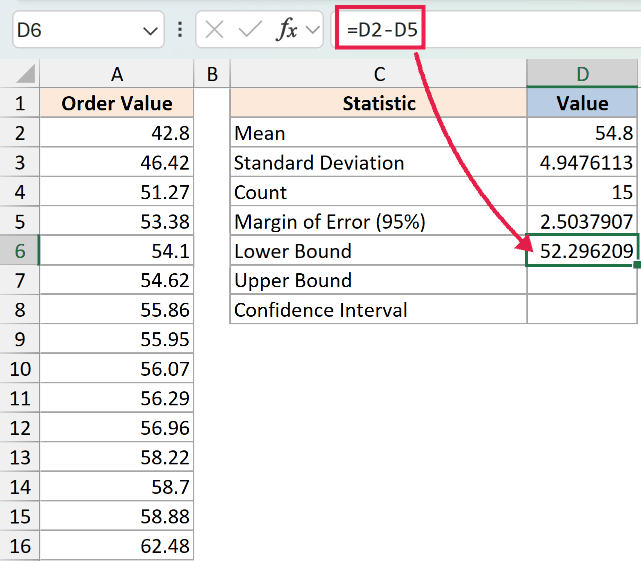
For my data, this gives 52.30 (that’s 54.8 − 2.50).
The upper bound is the mean plus the margin of error, which I’ll put in C7:
=D2+D5
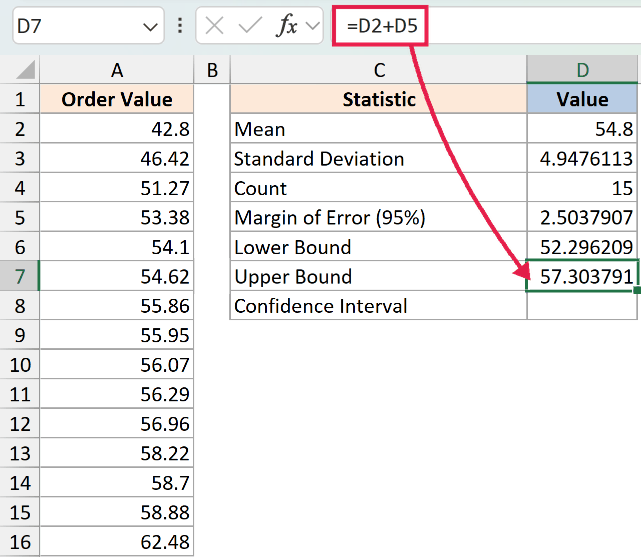
This gives 57.30 (that’s 54.8 + 2.50). Notice the bounds sit the exact same distance from the mean on each side, which is how a confidence interval always works.
Those two bounds together are your confidence interval. If you’d like to see it as a single value in one cell, you can join the two bounds with a bit of text in D8:
=TEXT(D6,"$0.00")&" to "&TEXT(D7,"$0.00")
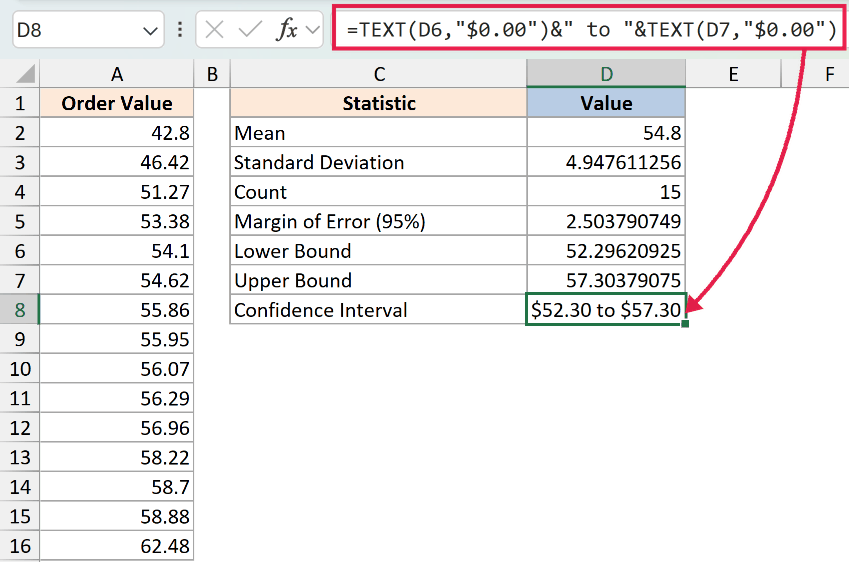
So the final answer is: I’m 95% confident the true average order value is between $52.30 and $57.30.
If you want a 99% confidence interval instead, just change the alpha to 0.01. Keep in mind a higher confidence level makes the interval wider, because you’re asking for more certainty.
Use CONFIDENCE.T for a Small Sample
CONFIDENCE.NORM, the version I used above, is built on the normal distribution (the bell curve). It assumes you know the standard deviation of the whole population and works best when your sample is on the larger side.
In practice you usually don’t know the population standard deviation, and your sample might be small. CONFIDENCE.T is built for exactly that. It uses the t-distribution, which adds a little extra width to account for the added uncertainty.
It works the same way, with the same three arguments in the same order:
=CONFIDENCE.T(0.05, D3, D4)
For my data, this returns a slightly larger margin of about 2.74, which gives an interval of roughly 52.06 to 57.54. It’s a touch wider than the CONFIDENCE.NORM result, which makes sense because we’re being a bit more cautious.
For most everyday data the two functions land in nearly the same place, so either one is fine. The Pro Tip below is a simple way to decide.
Pro Tip: Reach for CONFIDENCE.T when you don’t know the population standard deviation, or when your sample is small and you want to play it safe. Use CONFIDENCE.NORM when your sample is large or you already know the population standard deviation. For most samples the two give nearly the same answer.
Method 2: Calculate a Confidence Interval Using the Data Analysis ToolPak
If you’d rather not write formulas at all, the Data Analysis ToolPak’s Descriptive Statistics tool can hand you the margin of error as part of a summary table.
Turn On the Data Analysis ToolPak
First, you need the ToolPak turned on.
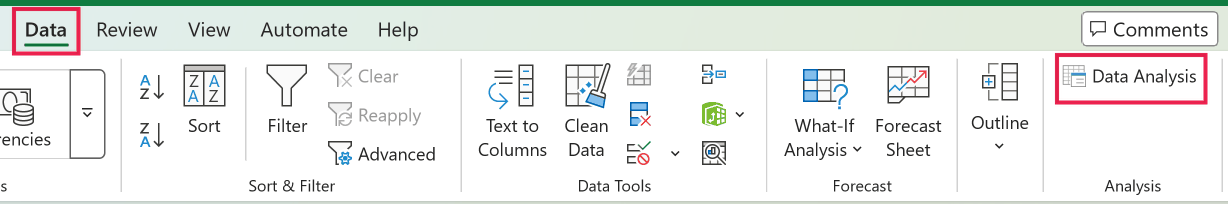
If you don’t see Data Analysis on the far right of the Data tab, here’s how to turn it on:
- Go to the File tab
- Click Options
- Click Add-ins
- In the Manage drop-down, pick Excel Add-ins
- Click Go
- Check Analysis ToolPak
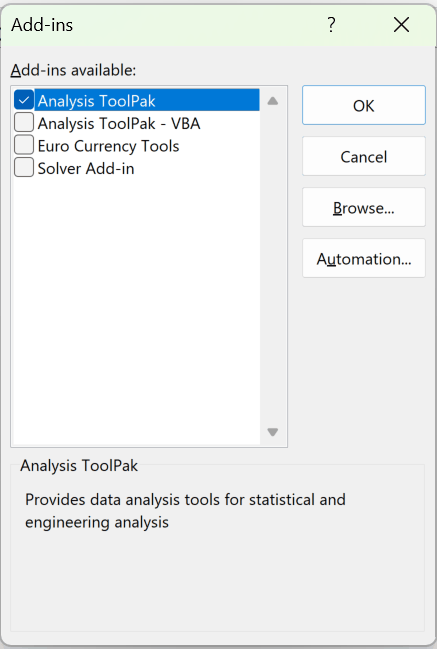
- Click OK
Run Descriptive Statistics to Get the Margin of Error
Here are the steps to get the margin of error using the ToolPak:
- Go to the Data tab and click Data Analysis on the far right.
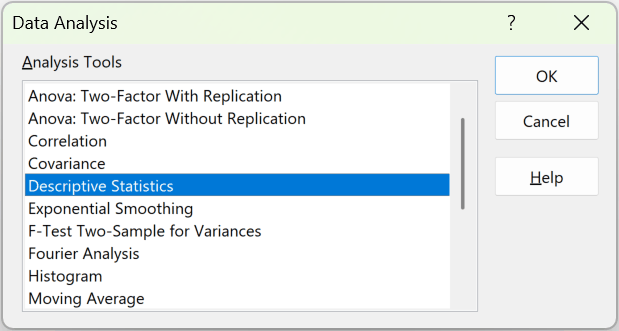
- Select Descriptive Statistics from the list and click OK.
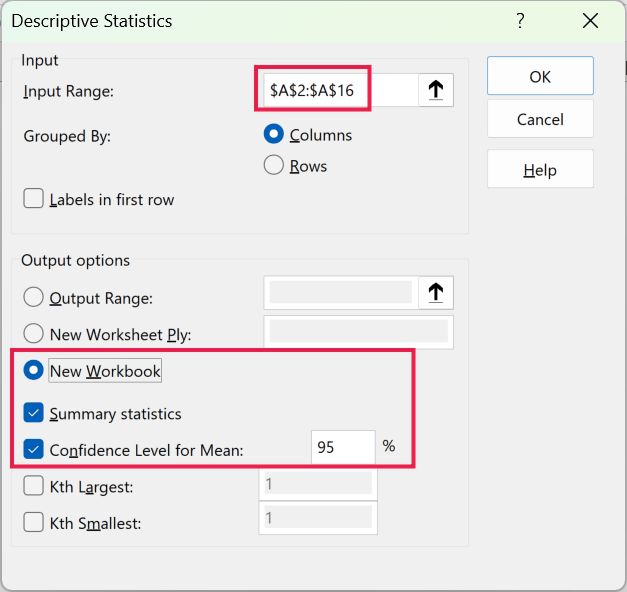
- Set the Input Range to your data, check Summary statistics, then check Confidence Level for Mean and leave it at 95%.
- Pick an Output Range or a new worksheet, then click OK.
The summary table includes a row called Confidence Level (95.0%).
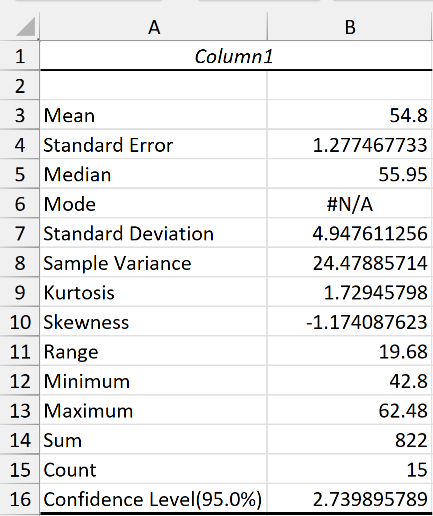
That value is your margin of error, the same as what CONFIDENCE.T gives you, since the ToolPak uses the t-distribution.
Add it to and subtract it from the mean to get your interval.
Things to Keep in Mind
- Alpha is not the confidence level. It’s 1 minus the confidence level. For 95% confidence use 0.05, for 99% use 0.01, and for 90% use 0.10. Mixing this up is the most common mistake.
- Use STDEV.S, not STDEV.P, for your standard deviation. Your data is almost always a sample, and STDEV.S is built for samples. STDEV.P is only for when you have data on the entire population.
- The interval is always symmetric around the mean. The lower and upper bounds sit the exact same distance from your sample average. If yours don’t, something is off in your formulas.
- A wider interval means less precision. Smaller samples and more spread-out data both widen the interval. If you want a tighter range, collect more data.
- CONFIDENCE (with no suffix) still works in Excel, but is the older version. It returns the same result as CONFIDENCE.NORM. Excel keeps it around for backward compatibility, but I’d use CONFIDENCE.NORM or CONFIDENCE.T in any new work.
In this article, I showed you two ways to calculate a confidence interval in Excel.
The formula method uses AVERAGE, STDEV.S, and COUNT for the building blocks, then CONFIDENCE.NORM (or CONFIDENCE.T) for the margin of error, which you add to and subtract from the mean.
The Data Analysis ToolPak gets you the same margin of error without a single formula. I hope you found this article helpful.
Other Excel Articles You May Also Like:


