
If you’re working with large datasets in excel, getting Descriptive Statistics for this data set could be useful.
Descriptive Statistic quickly summarizes your data and gives you a few data points that you can use to quickly understand the entire data set.
While you can also calculate each of these statistical values individually, using the descriptive statistics option in Excel quickly gives you all this data in one single place (and it’s a lot faster than using different formulas to calculate different values).
In this short tutorial, I will show you how to get Descriptive Statistics in Excel.
Descriptive Statistics in Excel
To get the Descriptive Statistics in Excel, you need to have the Data Analysis Toolpak enabled.
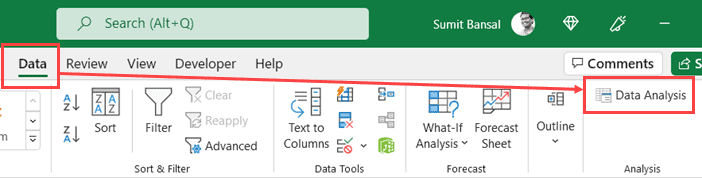
You can check whether you already have it enabled by going to the Data tab.
If you see the Data Analysis option in the Analysis group, you already have it enabled (and you can skip the next section and go directly to the ‘Getting Descriptive Analysis’ section).
In case you do not see the data analysis option in the data tab, follow the steps in the next section to enable it.
Enabling Data Analysis Toolpak
Below are the steps to enable the Data Analysis Toolpak in Excel:
- Open any Excel document
- Click the File tab

- Click on Options. This will open the Excel Options dialog box

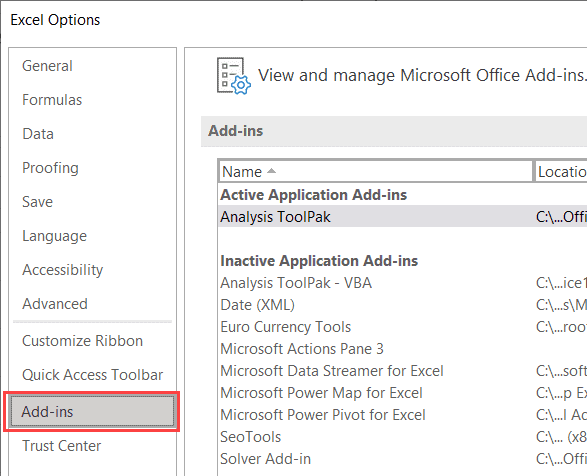
- In the Excel Options dialog box, click on Add-ins in the left pane
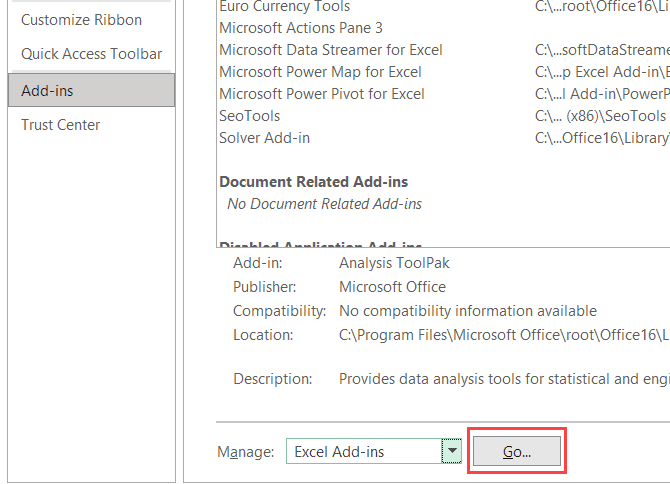
- From the Manage drop-down (which is at the bottom of the dialog box), select ‘Excel Add-ins’
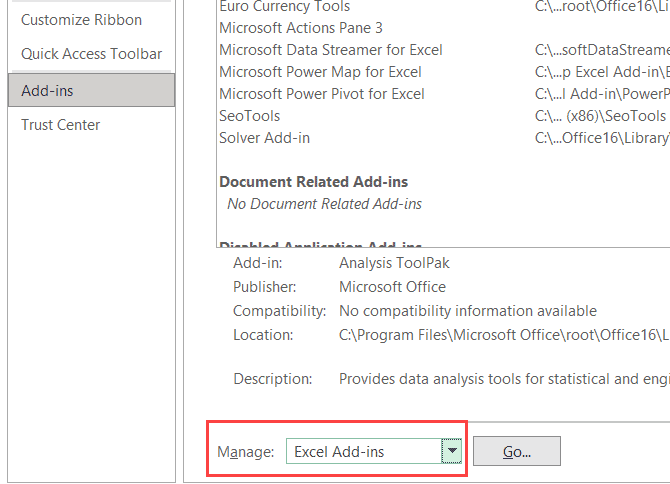
- Click on the Go button
- In the Add-ins dialog box that shows up, check the Analysis Toolpak option
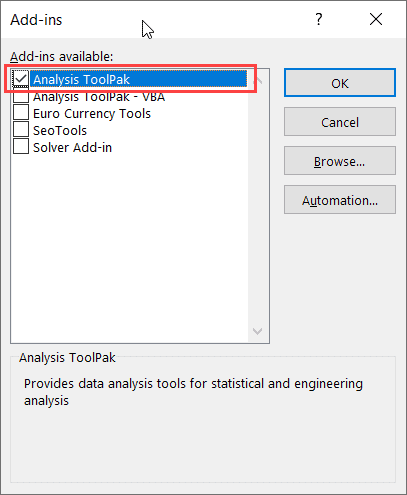
- Click OK
The other steps would enable the Data Analysis toolpak and you will be able to use it on all your Excel Workbooks.
Getting the Descriptive Analysis
Now that the Data Analysis Toolpak is enabled, let’s see how to get the descriptive statistics using it.
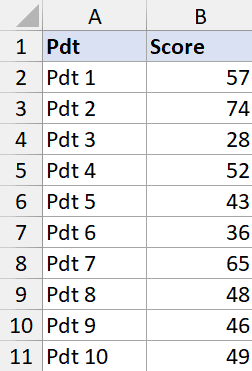
Suppose you have a data set as shown below where I have the sales data of different products of a company. For this data, I want to get descriptive statistics.
Below are the steps to do this:
- Click the Data tab
- In the Analysis group, click on Data Analysis
- In the Data Analysis dialog box that opens, click on Descriptive Statistics
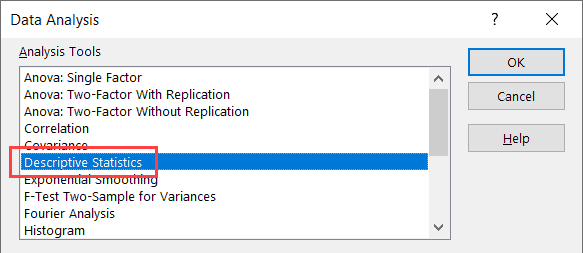
- Click OK
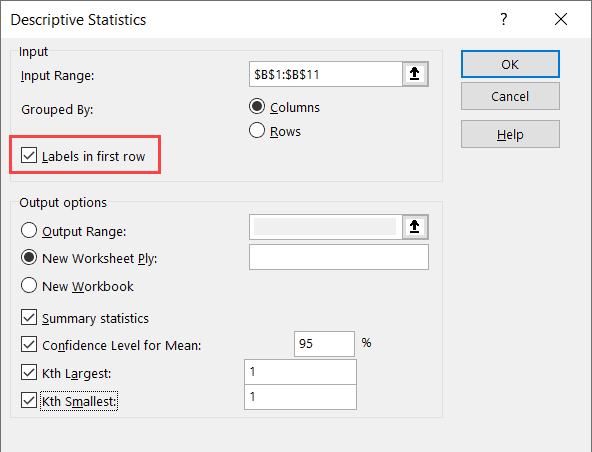
- In the Descriptive Statistics dialog box, specify the input range that has the data. Note that I have only used Column B as the data source (as you can only use numeric data as the input here)
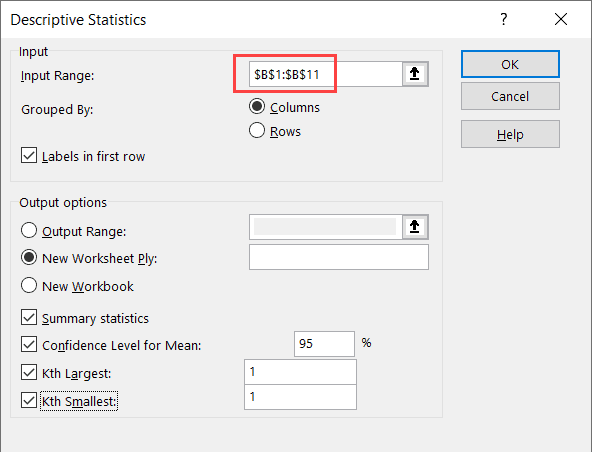
- If your data has headers, check the ‘Labels in first row’ option
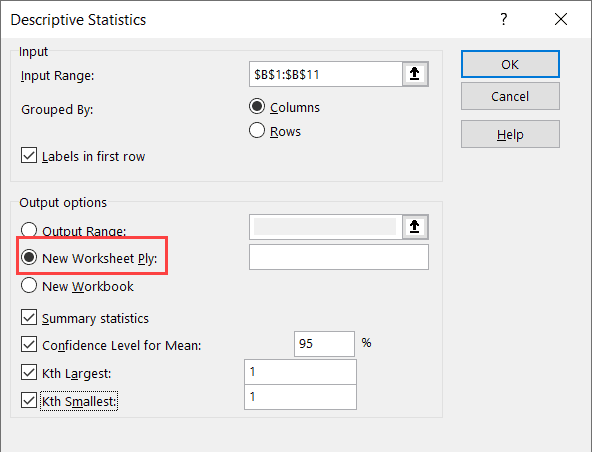
- Select the New Worksheet Ply option (this will give the result in a new sheet)
- Select the statistics options you want (you need to select atleast one, and can select all four)
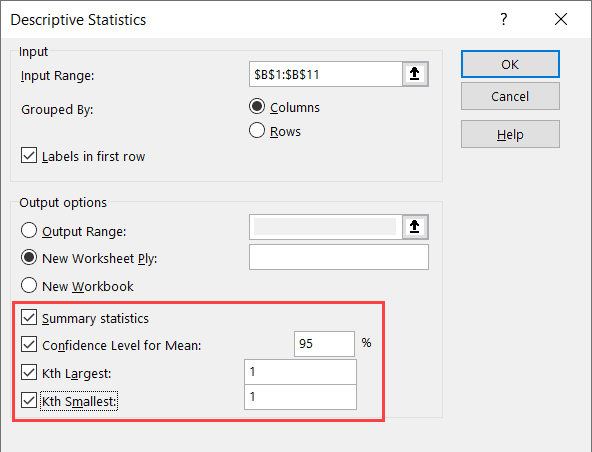
- Click OK
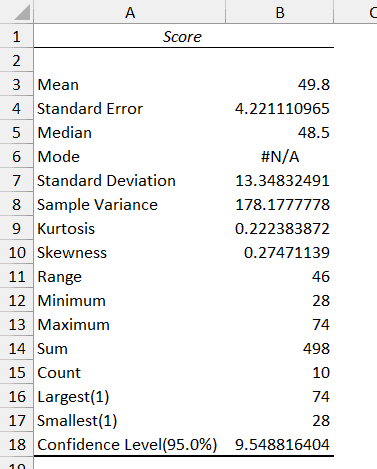
The above steps would insert a new sheet and you will get the statistics as shown below:
Note that you can specify the following in step 8:
- Confidence Level for mean – the default is 95%, but you can change the value
- Kth Largest – the default is 1, but you can change it. If you enter 3 here, it will give you the third largest value from the dataset
- Kth Smallest – the default is 1, but you can change it. If you enter 3 here, it will give you the third smallest value from the dataset
Note that the resulting values you get are static values.
In case your original data changes and you again want to get the Descriptive Statistics, you will have to repeat the above steps again.
So this is how you can quickly get Descriptive Statistics in Microsoft Excel.
I hope you found this tutorial useful.
Other Excel Tutorials you may also like:
- How to Calculate Standard Deviation in Excel
- How to Calculate PERCENTILE in Excel
- Calculating Weighted Average in Excel.
- Calculating CAGR in Excel
- How to Calculate Correlation Coefficient in Excel
- Calculate the Coefficient of Variation (CV) in Excel
- Calculate P-value in Excel
- Calculate Confidence Interval in Excel
- Calculate Standard Error in Excel
- How to Calculate Variance in Excel


This was really helpful, thanks so much.