
Coefficient of Variation (CV) is a common statistical metric used to understand the variability in your data set.
While there is no inbuilt formula to calculate the coefficient of variation in Excel, it can easily be done by first calculating the mean and the standard deviation of the data set separately and then calculating the coefficient of variation using these values.
In this short tutorial, I will show you how to calculate the coefficient of variation in Excel using a simple data set.
What is the Coefficient of Variation?
The Coefficient of Variation is a value (shown as a percentage) that tells us a measure of variation in our data set.
If this value is high, it indicates a high variation in our data set compared to the mean of the data set (i.e., some values are far higher or lower the mean of the dataset).
And if this value is low, it indicates a low variation in our data set, and most values lie closer to the mean.
For example, if we have a data set of heights of different students in a class, a high CV value would mean that the height of the class varies a lot (i.e., there are some students that are short and some that are long).
And if the coefficient of variation value is low, it indicates that most of the students in the class have a similar height which lies closer to the mean height of the group.
Also read: Calculate P-value in Excel
Calculating Coefficient of Variation in Excel
To calculate the coefficient of variation in Excel, we would first have to calculate the standard deviation and the mean of the data set and then use it to calculate the coefficient of variation value.
Let me show you how by using a simple example.
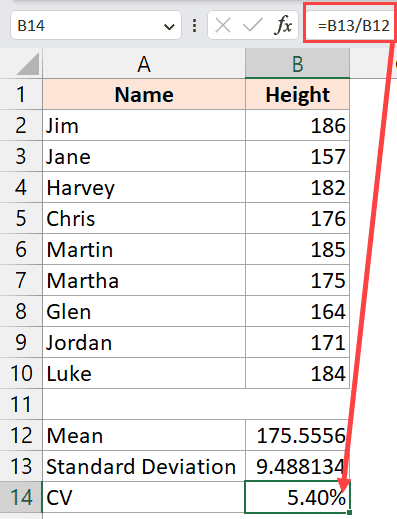
Below I have a data set where I have the height values (in cm) for some students in a class, and I want to calculate the coefficient of variation value for this data set.

Step 1 – Calculating the Mean of the Dataset
The first step is to calculate the mean of the given data set, and we will do that using the AVERAGE function in Excel.
Below is the formula that would give us the average of the heights in our data set:
=AVERAGE(B2:B10)

Step 2 – Calculating the Standard Deviation of the Dataset
The second step is to calculate the standard deviation of this data set.
This can be done using the inbuilt STDEV.P and STDEV.S functions in Excel (where STDEV.P calculates the standard deviation of the population and STDEV.S calculate the standard deviation of the sample).
For this tutorial, I will go ahead with the STDEV.P function.
Below is the formula that will give us the standard deviation of this data set:
=STDEV.P(B2:B10)

Step 3 – Calculating the Coefficient of Variation
And now, we can calculate the coefficient of variation by dividing the standard deviation value by the mean of the dataset.
Below is the formula that would give us the coefficient of variation value for this data:
=(B13/B12)
If you get the Coefficient of Variation value as a decimal, you can change that to a percentage.
To do this, select the cell that has the CV value, click on the Home tab, and then click on the percentage icon (it’s in the Number group)

While I’ve broken down the calculation into three different steps, you do not need to mean and the standard deviation value in separate cells to calculate the coefficient of variation.
You can use the single below formula to get the same result:
=STDEV.P(B2:B10)/AVERAGE(B2:B10)
Coefficient of Variation of Population vs. Sample
While calculating the standard deviation in step in step 2, I mentioned that you could either use the STDEV.P function or the STDEV.S function.
If you use the STDEV.P function to calculate the CV value, it would be the CV value for the population, and if you use STDEV.S function, the CV value will be for the sample.
While I’m not going to go too deep into the difference between the population and the sample, the general idea is that if you are calculating the standard deviation for an entire population, the value is considered to be more accurate, and when you are calculating it for a sample, it is considered to be slightly less accurate as it is only for a part of the population.
So if you know whether your data set is the entire population or the sample, you can calculate the coefficient of variation accordingly using the right standard deviation function.
In this tutorial, I showed you how to calculate the coefficient of variation in Excel. It can be done by dividing the standard deviation of the data set by the mean of the data set (both of which can easily be calculated using the inbuilt functions in Excel).
Other Excel articles you may also like:
- How to Calculate Correlation Coefficient in Excel
- Calculating Weighted Average in Excel
- Percent Increase Formula in Excel
- How to Get Descriptive Statistics in Excel?
- How to Calculate PERCENTILE in Excel
- How to Find Slope in Excel? Using Formula and Chart
- Calculate Chi-Square in Excel
- Calculate Confidence Interval in Excel


