
Excel is used extensively for statistics and data analysis. Standard deviation is something that is used quite often in statistical calculations.
In this tutorial, I will show you how to calculate the standard deviation in Excel (using simple formulas)
But before getting into, let me quickly give you a brief overview of what standard deviation is and how it’s used.
What is Standard Deviation?
A standard deviation value would tell you how much the data set deviates from the mean of the data set.
For example, suppose you have a group of 50 people, and you are recording their weight (in kgs).
In this data set, the average weight is 60 kg, and the standard deviation is 4 kg. It means that most of the people’s weight is within 4 kg of the average weight (which would be 56-64 kg).
Now let’s interpret the standard deviation value:
- A lower value indicates that the data points tend to be closer to the average (mean) value.
- A higher value indicates that there is widespread variation in the data points. This can also be a case when there are many outliers in the data set.

Calculating Standard Deviation in Excel
While it’s easy to calculate the standard deviation, you need to know which formula to use in Excel.
There are six standard deviation formulas in Excel (eight if you consider database functions as well).
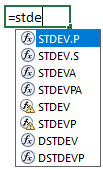
These six formulas can be divided into two groups:
- Calculating the sample standard deviation: The formulas in this category are STDEV.S, STDEVA, and STDEV
- Calculating the standard deviation for an entire population: The formulas in this category are STDEV.P, STDEVPA, and STDEVP
In almost all of the cases, you will use standard deviation for a sample.
Again in layman terms, you use the term ‘population’ when you want to consider all the datasets in the entire population. On the other hand, you use term ‘sample’ when using a population is not possible (or it’s unrealistic to do so). In such a case, you pick a sample from the population.
You can use the sample data to calculate the standard deviation and infer for the entire population. You can read a great explanation of it here (read the first response).
So. this narrows down the number of formulas to three (STDEV.S, STDEVA, and STDEV function)
Now let’s understand these three formulas:
- STDEV.S – Use this when your data is numeric. It ignores the text and logical values.
- STDEVA – Use this when you want to include text and logical values in the calculation (along with numbers). Text and FALSE are taken as 0 and TRUE is taken as 1.
- STDEV – STDEV.S was introduced in Excel 2010. Before it, the STDEV function was used. It is still included for compatibility with prior versions.
So, you can safely assume that in most of the cases, you would have to use STDEV.S function (or STDEV function if you’re using Excel 2007 or prior versions).
So now let’s see how to use it in Excel.
Using STDEV.S Function in Excel
As mentioned, STDEV.S function uses numerical values but ignores the text and logical values.
Here is the syntax of STDEV.S function:
STDEV.S(number1,[number2],…)
- Number1 – This is a mandatory argument in the formula. The first number argument corresponds to the first element of the sample of a population. You can also use a named range, single array, or a reference to an array instead of arguments separated by commas.
- Number2, … [Optional argument in the formula] You can use up to 254 additional arguments. These can refer to a data point, a named range, a single array, or a reference to an array.
Now, let’s have a look at a simple example where we calculate the standard deviation.
Also read: Calculate Interquartile Range (IQR) in Excel
Example – Calculating the Standard Deviation for Weight Data
Suppose you have a data set as shown below:
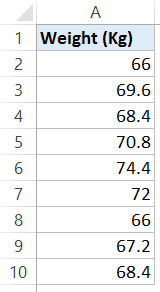
To calculate the standard deviation using this data set, use the following formula:
=STDEV.S(A2:A10)
In case you’re using Excel 2007 or prior versions, you will not have the STDEV.S function. In that case, you can use the below formula:
=STDEV(D2:D10)
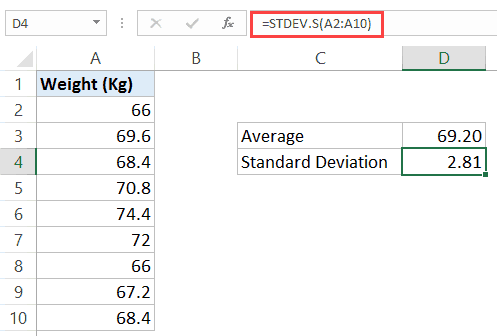
The above formula returns the value of 2.81, which indicates that most of the people in the group would be within the weight range 69.2-2.81 and 69.2+2.81.
Note that when I say ‘most of the people’, it refers to the normal distribution of the sample (that is 68% of the sample population is within one standard deviation from the mean).
Also, note that this is a very small sample set. In reality, you may have to do this for a bigger sample data set where you can observe normal distribution better.
Hope you found this Excel tutorial useful.
You May Also Like the Following Excel Tutorials:
- Calculating Weighted Average in Excel.
- Calculating CAGR in Excel.
- Calculate and Format Percentages in Excel.
- Calculate Age in Excel using Formulas.
- Creating a Bell Curve in Excel.
- Calculating Compound Interest in Excel.
- How to Calculate Square Root in Excel
- Calculate the Coefficient of Variation (CV) in Excel
- How to Calculate Correlation Coefficient in Excel
- How to Get Descriptive Statistics in Excel?
- Standard Deviation Calculator
- Calculate Confidence Interval in Excel
- Calculate Standard Error in Excel
- How to Forecast in Excel
- How to Calculate Variance in Excel


Very useful applications.
Thanks.