

The FORECAST.ETS.SEASONALITY function in Excel tells you how long the repeating pattern in your data is. For daily sales that jump every weekend, it returns 7, and for quarterly numbers that peak every winter, it returns 4.
It’s the same pattern length the FORECAST.ETS function uses when it builds a forecast. So it’s a handy way to check what Excel saw in your numbers before you trust that forecast.
In this article, I’ll show you how to read its result, why it sometimes returns 0, and how to handle closed days, weekday-only data, and several columns at once.
Follow along with the example file
FORECAST.ETS.SEASONALITY Function Examples.xlsx
FORECAST.ETS.SEASONALITY Function Syntax
Here is the syntax of the FORECAST.ETS.SEASONALITY function:
=FORECAST.ETS.SEASONALITY(values, timeline, [data_completion], [aggregation])
- values – The historical numbers you want to check for a pattern, such as daily sales.
- timeline – The dates (or period numbers) that go with those values.
- [data_completion] – Optional. What to do with missing values. Leave it out (or use 1) to fill each gap with the average of its neighbors, or use 0 to count gaps as zero.
- [aggregation] – Optional. How to combine values that share the same date. The default is 1 (AVERAGE). The others are 2 (COUNT), 3 (COUNTA), 4 (MAX), 5 (MEDIAN), 6 (MIN), and 7 (SUM).
The result is a whole number counted in timeline steps, so 7 on daily data means a pattern that repeats every 7 days. A result of 0 means Excel didn’t find a repeating pattern.
The timeline needs a regular step between its dates, such as one day, one week, one month, or one quarter. If Excel can’t find a regular step, the function returns the #NUM! error.
The values and timeline ranges also have to be the same size. If one is a row longer than the other, you get the #N/A error.
The dates don’t have to be in order. You get the same result even if the rows are shuffled.
The aggregation argument only matters when the same date shows up more than once in the timeline, like an order log with several rows per day. Excel combines those rows into one value per date before it looks for a pattern.
The FORECAST.ETS.SEASONALITY function works in Excel 2016 and later on Windows and Mac, including Microsoft 365, 2024, 2021, and 2019. It is not available in Excel for the web or in the Excel mobile apps.
When to Use the FORECAST.ETS.SEASONALITY Function
Use this function when you need to:
- Find out whether your data has a repeating pattern, and how long that pattern is
- Check which pattern length the FORECAST.ETS function will use before you trust its forecast
- Pick the right number for the seasonality argument of the FORECAST.ETS function
- Compare the patterns of several products or series at once
Let me show you a few practical examples of how to use the FORECAST.ETS.SEASONALITY function.
Example 1: Find the Weekly Seasonality in Daily Sales
Let’s start with a simple example.
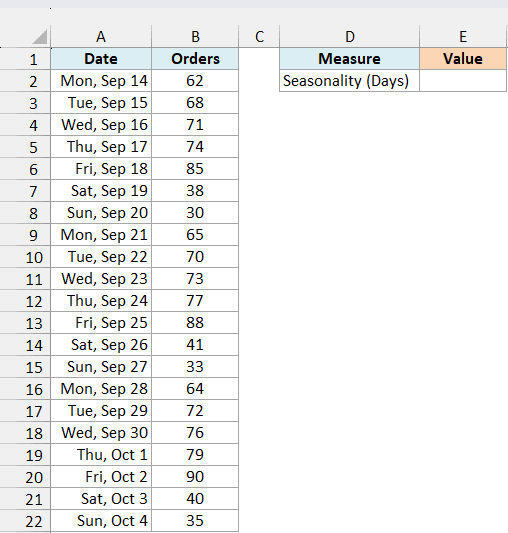
Below I have the number of orders a sandwich shop got each day for three weeks, and I want to find the length of its repeating pattern in cell E2.
Here is the formula:
=FORECAST.ETS.SEASONALITY(B2:B22,A2:A22)
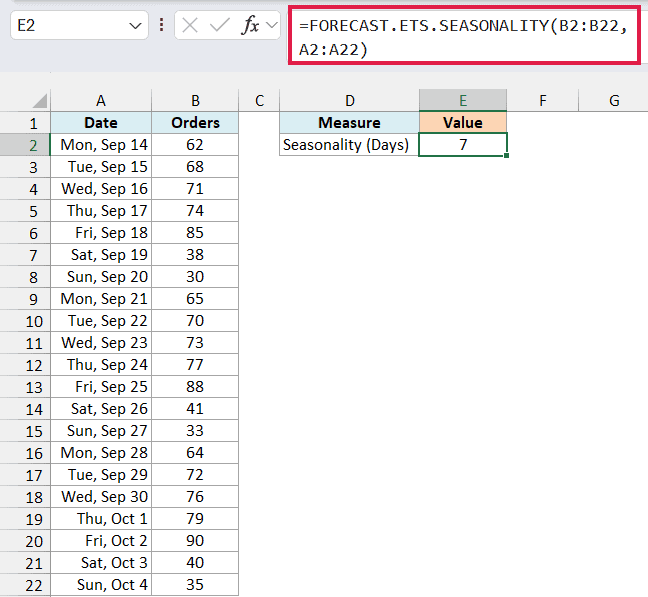
B2:B22 has the daily orders, and A2:A22 has the dates they belong to. The formula returns 7, which means Excel found a pattern that repeats every 7 days.
That matches the data. Orders climb from the 60s on Monday to between 85 and 90 on Friday, then drop to between 30 and 41 every weekend.
This is also the pattern length the FORECAST.ETS function would use if you asked it to forecast next week’s orders and left its seasonality argument out.
Example 2: Check for a Yearly Pattern in Quarterly Numbers
Here’s one with a longer cycle.
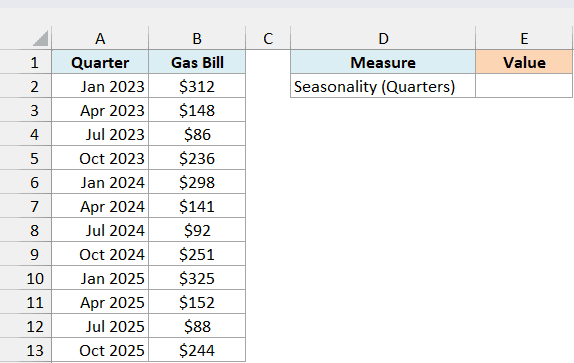
Below I have a household’s gas bill for each quarter from 2023 to 2025, and I want to check its seasonal pattern in cell E2.
Here is the formula:
=FORECAST.ETS.SEASONALITY(B2:B13,A2:A13)
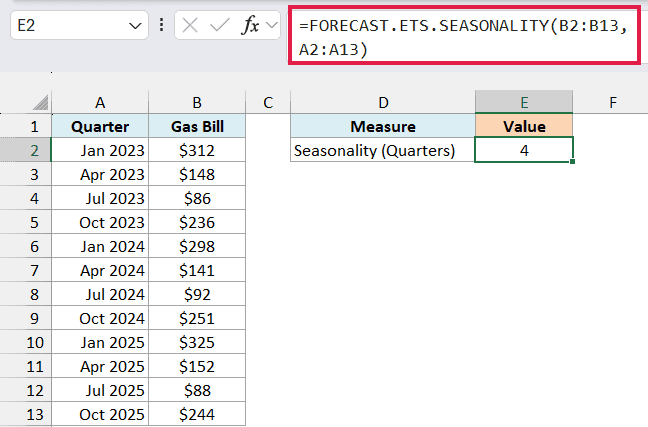
The formula returns 4. Since each row is one quarter, the pattern repeats every 4 quarters, which is once a year.
You can see why in the data. The January quarter is the most expensive one every year ($298 to $325) because of heating, and the July quarter is the cheapest ($86 to $92).
The quarters in column A are entered as the first day of each quarter (January 1, April 1, and so on). Excel treats that as a regular three-month step, even though the months have different numbers of days.
Example 3: When FORECAST.ETS.SEASONALITY Returns 0
Now let’s look at data that doesn’t repeat.
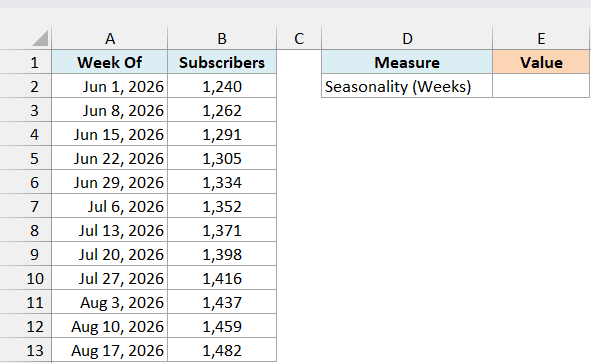
Below I have the total subscribers of a newsletter at the start of each week for 12 weeks, and I want to check it for a repeating pattern in cell E2.
Here is the formula:
=FORECAST.ETS.SEASONALITY(B2:B13,A2:A13)
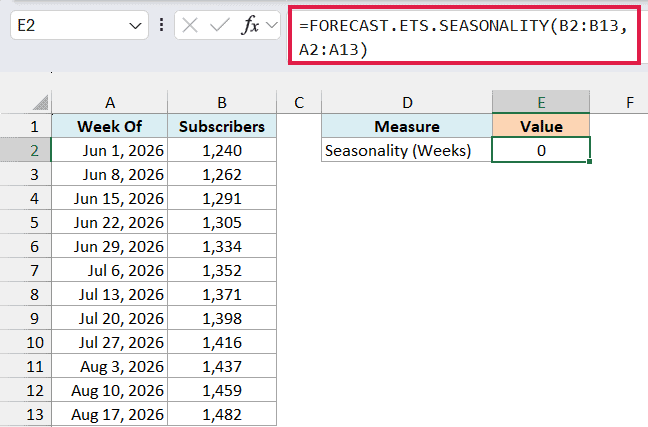
The formula returns 0, which means Excel found no repeating pattern. The subscriber count just climbs steadily from 1,240 to 1,482, with no week that’s regularly higher or lower than the rest.
That’s a normal result, and it doesn’t mean anything went wrong. If you forecast this data with the FORECAST.ETS function, Excel follows the upward trend alone, without any seasonal ups and downs.
Example 4: Not Enough History (Two Weeks vs Three)
Here’s another reason you can get a 0.
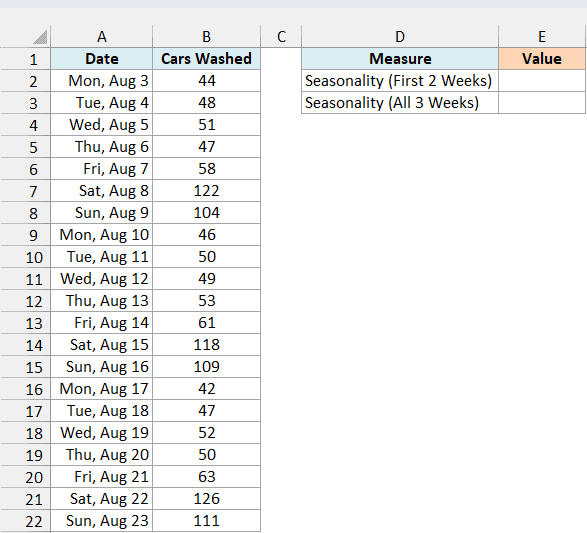
Below I have the number of cars washed each day at a car wash for three weeks, and I want to check the pattern using the first two weeks in E2 and all three weeks in E3.
Here is the formula for the first two weeks:
=FORECAST.ETS.SEASONALITY(B2:B15,A2:A15)
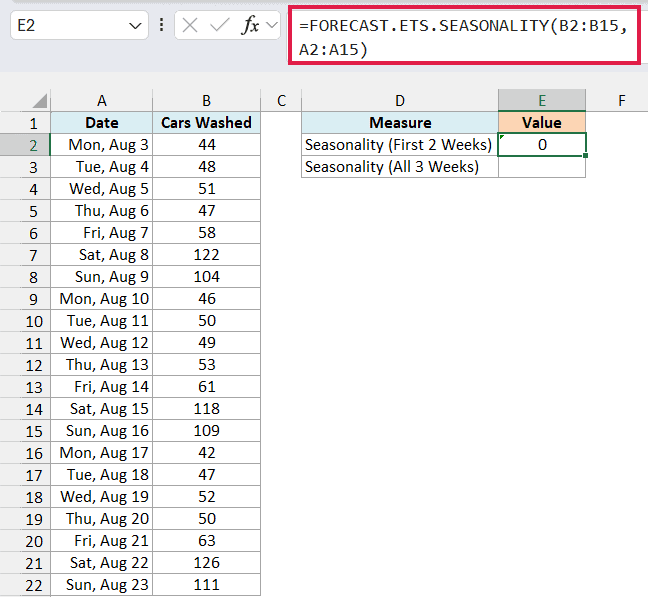
This formula only looks at the first 14 days (August 3 to 16). It returns 0, even though both weekends are clearly much busier than the weekdays.
Two weeks is only two rounds of the weekly cycle, and that isn’t enough for Excel to treat it as a pattern.
Here is the formula for all three weeks:
=FORECAST.ETS.SEASONALITY(B2:B22,A2:A22)
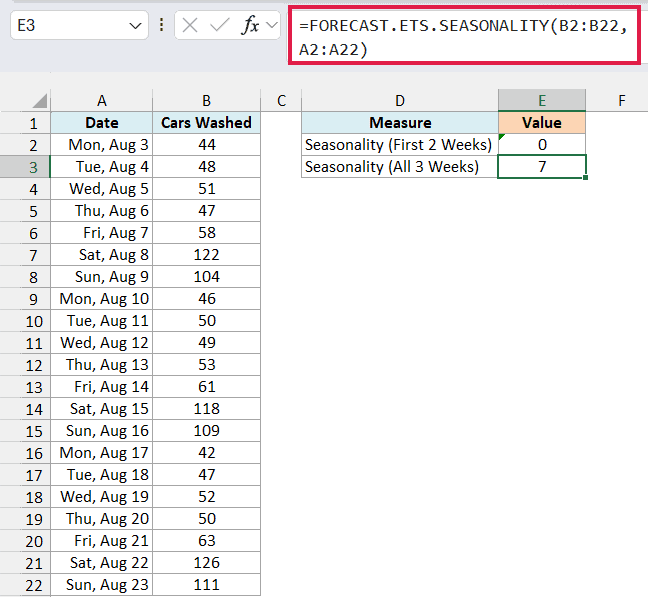
With the third week added, the result changes to 7. It’s the same kind of data and the same formula, just with one more week of history.
Important: A 0 can mean there’s no pattern, or that your history is too short to show it. Give the function at least three full cycles of data, for example three weeks of daily data or three years of monthly data.
It can go wrong the other way too. Short or noisy data can sometimes return a cycle that doesn’t match anything about your business, like 3 or 8 days.
If the number doesn’t make sense, go with what you know about your data. Enter the right cycle (or 0 for no pattern) as the seasonality argument of the FORECAST.ETS function yourself.
Example 5: Closed Days, Blanks vs Zeros (data_completion)
Here’s a scenario where the optional data_completion argument changes the answer.
Below I have the daily visitors at a public library for four weeks, with the Sundays left blank because the library is closed, and I want to check the pattern with the blanks filled in (E2) and counted as zero (E3).
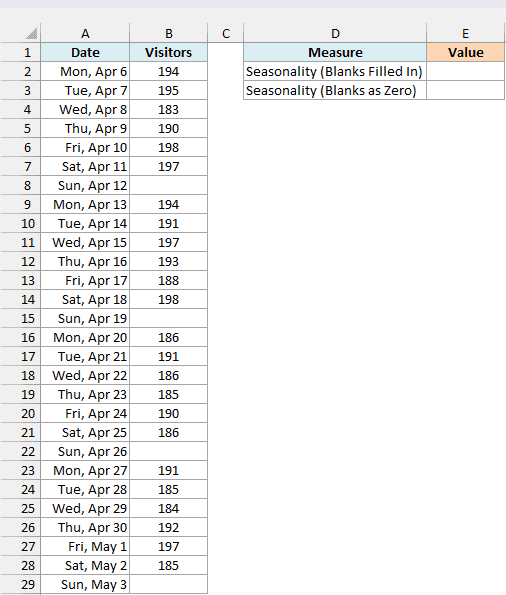
Here is the formula that fills in the blanks:
=FORECAST.ETS.SEASONALITY(B2:B29,A2:A29)
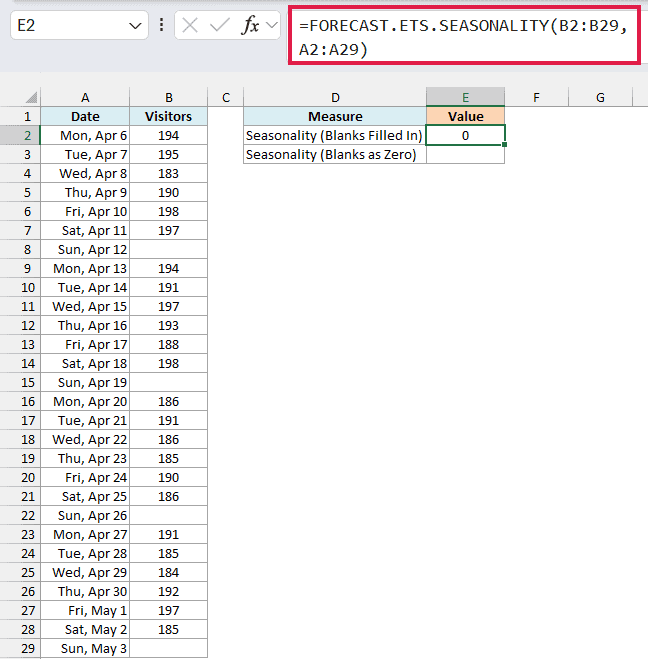
With data_completion left out, Excel fills each blank Sunday with the average of the days around it. That turns every Sunday into a normal day, so there’s no pattern left to find, and the result is 0.
Here is the formula that counts the blanks as zero:
=FORECAST.ETS.SEASONALITY(B2:B29,A2:A29,0)
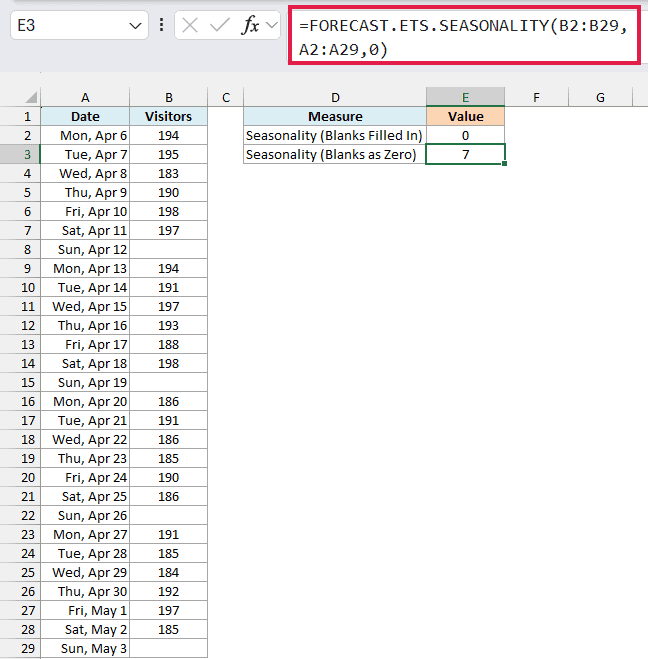
Setting data_completion to 0 counts each blank as zero visitors, which is the truth for a closed day. Now every seventh day drops to zero, and Excel returns 7.
So pick the setting based on what your blanks mean. Use 0 when a blank means nothing happened (like a closed day), and leave the argument out when a blank means the number just wasn’t recorded.
Example 6: Weekday-Only Data (Use Day Numbers)
Now let’s look at data that only has weekdays.
Below I have the lunches sold at an office cafeteria that’s open Monday to Friday, with a day number for each row in column B, and I want to check the pattern using the dates (F2) and the day numbers (F3).
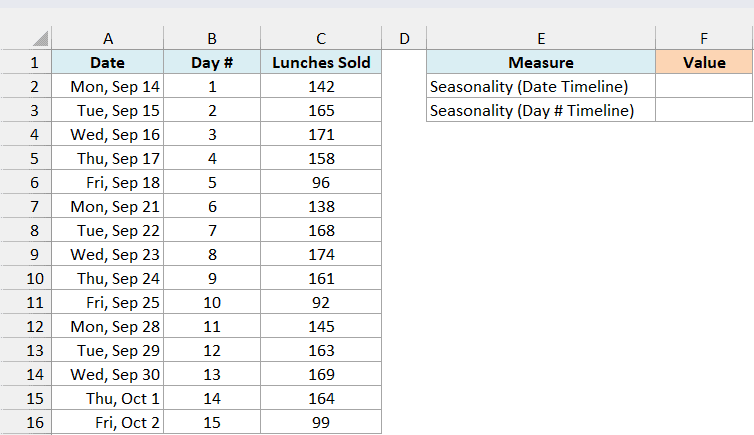
Here is the formula that uses the dates:
=FORECAST.ETS.SEASONALITY(C2:C16,A2:A16)
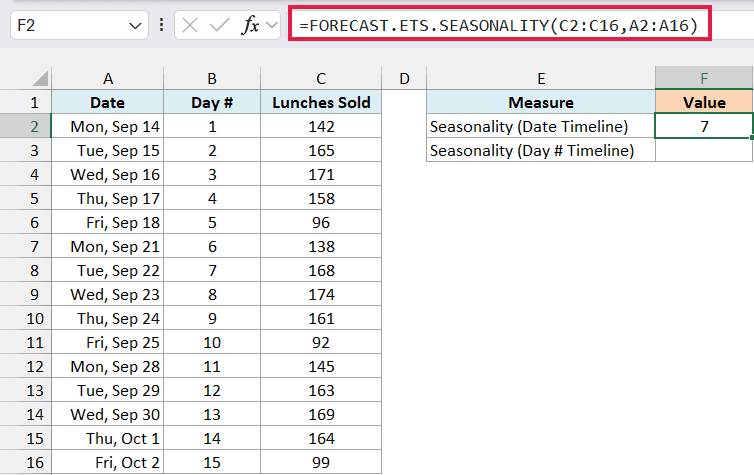
With the dates as the timeline, the formula returns 7, even though the cafeteria only has a 5-day week.
Most of the dates are one day apart, so Excel uses a one-day step and sees Saturday and Sunday as two missing days every week. The 7 is the same weekly cycle, just counted in calendar days.
The formula still returns a result because 2 missing days out of every 7 is under 30%, the most missing data Microsoft says the function can handle.
But by default, Excel fills those weekend gaps with averages of the days around them (like the blank Sundays in Example 5). So it’s looking for a pattern in lunches that were never sold.
Here is the formula that uses the day numbers:
=FORECAST.ETS.SEASONALITY(C2:C16,B2:B16)
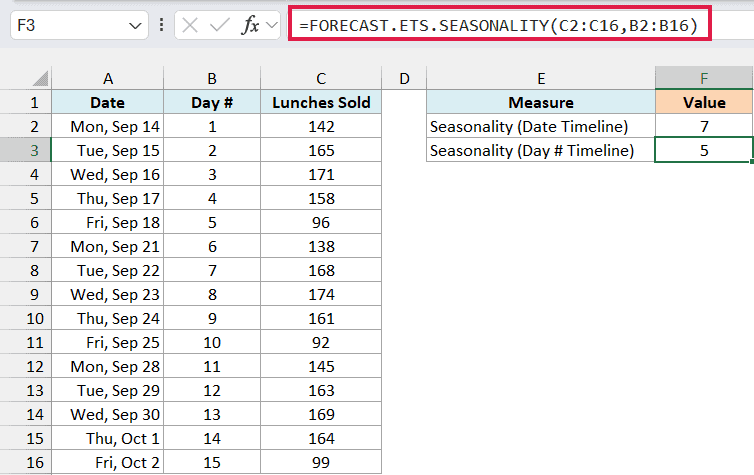
With the day numbers as the timeline, each row is one step and there are no gaps to fill. Now the formula returns 5, which matches the real pattern of busy days in the middle of the week and a big drop every Friday.
If you forecast weekday-only data with the FORECAST.ETS function, use the same day numbers as its timeline. The date you want to forecast then has to be a day number too, so for next Monday you’d use 16 instead of a calendar date.
Example 7: Check Several Products at Once With BYCOL
Let’s end with a dynamic array formula that checks several columns in one go.
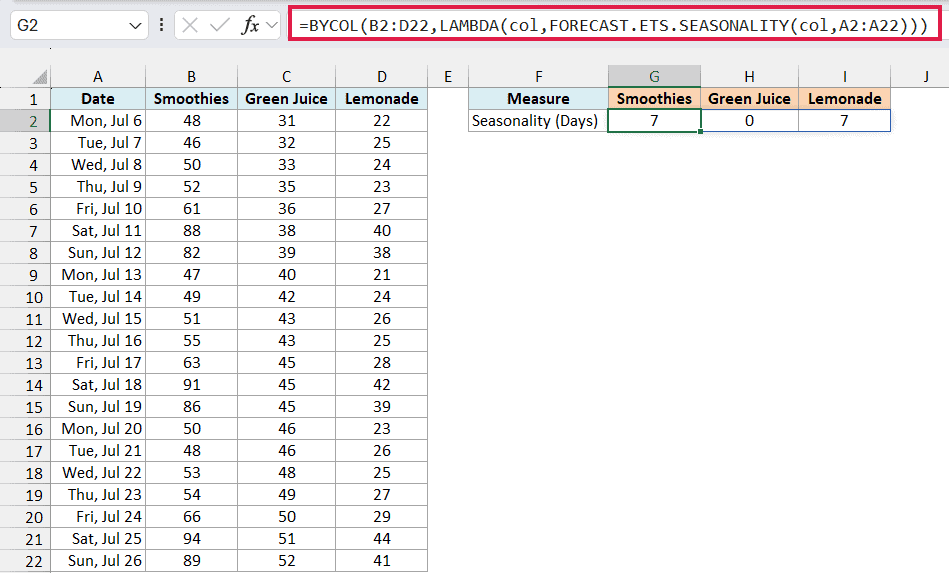
Below I have a juice bar’s daily sales of three drinks for three weeks, and I want the seasonality of each drink in G2:I2.
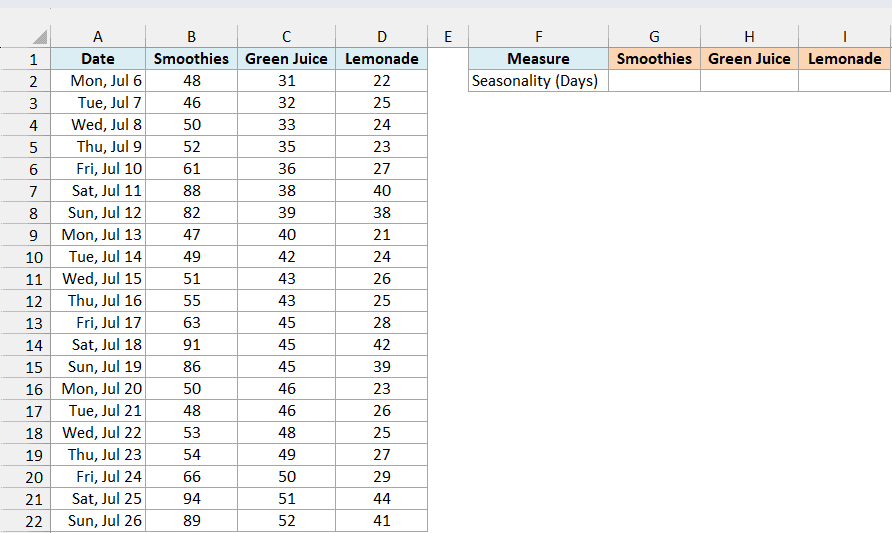
Here is the formula:
=BYCOL(B2:D22,LAMBDA(col,FORECAST.ETS.SEASONALITY(col,A2:A22)))
How this formula works:
- BYCOL(B2:D22, …) takes the three drink columns and runs the LAMBDA on each column, one at a time.
- LAMBDA(col, …) gives the current column the name col.
- FORECAST.ETS.SEASONALITY(col,A2:A22) checks that column against the dates in A2:A22 and returns its pattern length.
The results spill into G2:I2. Smoothies and Lemonade both return 7 because they jump every weekend, while Green Juice returns 0 because it just creeps up slowly over the three weeks.
You need the BYCOL function here. If you give FORECAST.ETS.SEASONALITY all three columns at once (B2:D22), it returns the #N/A error instead of three results.
The BYCOL function works in Microsoft 365 and Excel 2024. If you are using Excel 2021 or earlier, enter the below formula in cell G2 and then copy it to H2 and I2:
=FORECAST.ETS.SEASONALITY(B2:B22,$A$2:$A$22)
So these are a few examples of how to use the FORECAST.ETS.SEASONALITY function in Excel. Use it to check the pattern behind a forecast, and remember that a 0 can mean either no pattern or not enough history.
If your data has no seasonal pattern at all, the FORECAST.LINEAR function is a simpler way to forecast it.
I hope you found this article helpful.
Other Excel Articles You May Also Like:
