
With financial data, you would often see the use of two metrics – Average Annual Growth Rate (AAGR) and Compound Annual Growth Rate (CAGR).
While there are some existing formulas in Excel that can help you calculate growth rates, for calculating AAGR and CAGR, you would need a little bit of workaround (nothing too complex though).
In this tutorial, I will cover how to calculate the Average Annual Growth Rate (AAGR) in Excel.
But before I get into how to calculate AAGR in Excel, let me quickly cover what it is and what does it mean.
In case you just want to know how to calculate it in Excel, click to jump to that section.
What is Average Annual Growth Rate (AAGR)?
Average Annual Growth Rate (AAGR), as the name suggests, is the average of the annual growth rate.
For example, if I tell you that your stock portfolio has grown with an AAGR of 10% in the last 5 years, it simply means that you have added 10% of the value every year (at the end of the year as compared with the beginning of the year).
This may not mean that it has grown exactly 10% each year. It just means that at the end of the fifth year, it gave as an AAGR of 10% overall.
Average Annual Growth Rate is often used by investors to see how their portfolio is doing or what’s the trend of a company’s revenue/cost/profit.
Now let’s see how to calculate the Average Annual Growth Rate in Excel.
Calculating Average Annual Growth Rate (AAGR) in Excel
Calculating Average Annual Growth Rate (AAGR) in Excel is a two-step process (unlike CAGR, which can be calculated with a single formula).
To calculate AAGR for multiple years, you first need to calculate the growth rate for each year and then you can calculate the average if each year to get the AAGR.
Suppose you have the following values for each year:
- Value at the Beginning = $100,000
- End of year 1 value = $135,000
- End of year 2 value = $145,000
- End of year 3 value = $170,000
- End of year 4 value = $200,000
With the above data, you can calculate the growth rate for each year by using the below formula:
=(Ending Value / Beginning Value) - 1
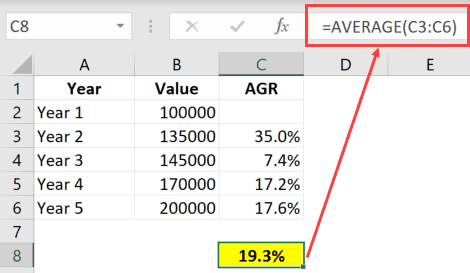
With the above dataset, you will get the following growth rates:
- Growth rate for Year 1 = $135,000 / $100,000 – 1 = 35.0%
- Growth rate for Year 2 = $145,000 / $135,000 – 1 = 7.4%
- Growth rate for Year 3 = $170,000 / $145,000 – 1 = 17.2%
- Growth rate for Year 4 = $200,000 / $170,000 – 1 = 17.6%
Now to calculate the average annual growth rate, you can use the below formula in Excel:
=AVERAGE(C3:C6)
And can you do this with one single formula in Excel?
Yes… You can!
Below is the formula that will use the year-wise data that you have to give you the AAGR value:
=AVERAGE((B3:B6-B2:B5)/B2:B5)

If you’re using Office 365 and have access to dynamic arrays, you can simply use the above formula and get the result.
In case you’re using Excel 2010, 2013, 2016, you need to use Control + Shift + Enter with this formula (hold the Control and the Shift key and then press the Enter key).
In case you want to learn how to calculate CAGR in Excel, I have a detailed tutorial on it (that covers multiple formula ways to calculate it in Excel)
Also read: How To Calculate Percentage Increase In Excel
AAGR Vs CAGR
This tutorial would be incomplete if I don’t cover the difference between the Average Annual Growth Rate (AAGR) and the Compound Annual Growth Rate (CAGR).
While both calculate the annual growth rate, AAGR completely ignores the impact of compounding that accrues over the years.
On the other hand, CAGR would account for the compounding effect.
While AAGR is a good metric to use to know the overall growth trend, it can sometimes lead to overestimation of the growth rate.
For example, in the below example, the value of the investment in Year 1 and Year 5 is the same, but the AAGR would make you believe that the investment grew at a 4.6% rate (which is not true). On the contrary, CAGR gives you the correct picture where it shows you that the growth rate is 0%.

Because of this possibility of error, CAGR is more widely used in financial analysis and reporting.
Nevertheless, AAGR has its value in the financial world and is often used to get an idea of the overall trend.
So, this is how you can easily calculate the Average Annual Growth Rate in Excel. You can take the longer route of first calculating the growth rate of each year and then take an average, or use the single array formula to get the same result.
Hope you found this tutorial useful!
You may also like the following Excel tutorials:
- Calculating Moving Average in Excel [Simple, Weighted, & Exponential]
- Calculating Weighted Average in Excel (Using Formulas)
- How to Use Excel AVERAGEIFS Function
- How to Calculate Ratios in Excel?
- How to Calculate IRR in Excel (Internal Rate of Return)
- Calculating NPV (Net Present Value) in Excel (Easy Formulas)
- Weighted Average Calculator
- Growing Annuity Formula in Excel


