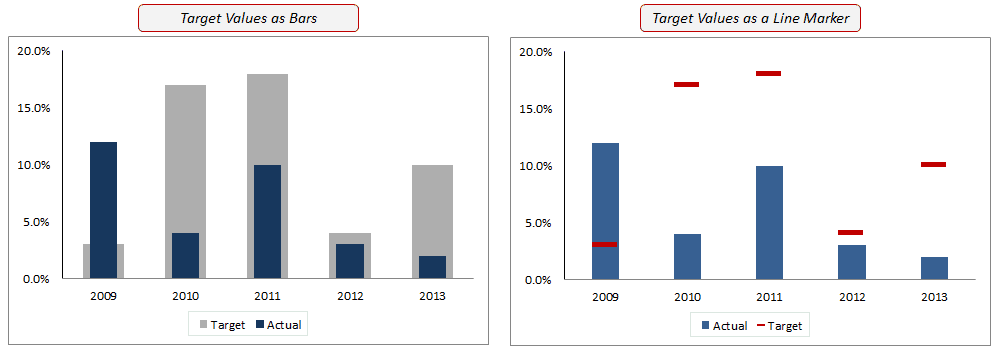
Creating Actual vs Target Chart in Excel (2 Examples)

If you work involves reporting the actual and target data, you may find it useful to present the actual values versus the target values in a chart in Excel. For example, you can show the actual sales values versus the target sales values, or the satisfaction rating achieved versus the target rating. There can be …

Read more

Identify Errors Using Excel Formula Debugging (2 Methods)

Imagine you have created a super long formula in Excel. While you are proud of yourself, there is a minor glitch. It is returning an error or an unexpected value. Now you have two options: Excel Formula Debugging Method #1 – F9 Key Here is how this works: For example, suppose you have the text …

Read more

How to Select Blank Cells in Excel

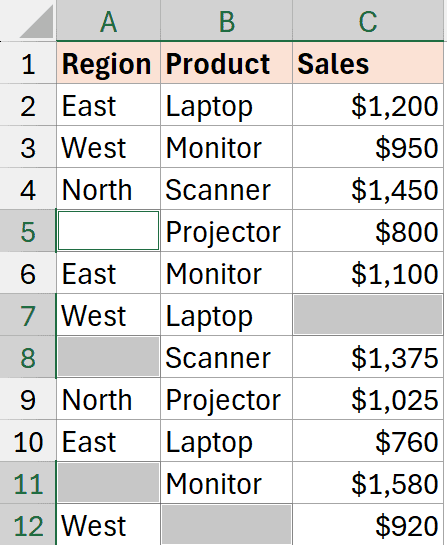
Excel data table with all empty cells in columns A, B, and C highlighted and selected

When you have a big dataset with blank cells scattered through it, manually clicking each one is a waste of time. Excel has a few quick ways to grab every blank cell at once so you can fill them, delete them, format them, or do whatever else you need. In this article, I’ll show you …

Read more

Dynamic Excel Chart with Series Selection Check-box

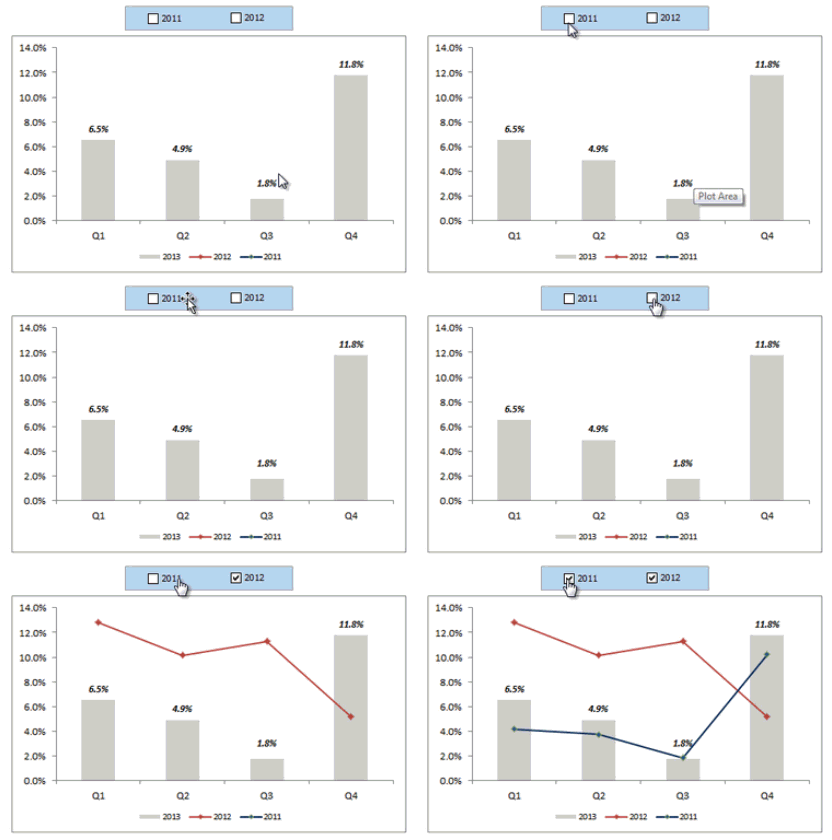
Apart from being super cool, Excel dynamic charts are really helpful in presenting a comparative analysis from the data. Suppose you have the financial data for a company ABC Ltd, and you want to see how the revenue has grown over the quarters. At the same time, you also want to compare the growth with …

Read more

How to Create Combination Charts in Excel – Step-by-Step Tutorial

Combination charts in Excel let you present and compare two different data-sets that are related to each other (in a single chart). When you create a regular chart in Excel, it usually has only one X-axis and one Y-axis. But with combination charts, you can have two Y-axis, which allows you to have two different …

Read more

How to Handle Data Gaps in Excel Charts (Examples)

A lot of times we have charts that have to handle empty data cells. Excel gives you the flexibility to decide how the empty cells should be treated. Suppose I have the data for date-wise sales of a product from a shop. Assuming that the shop is closed on Sunday and national holidays, there are …

Read more

How to Create Multi-category Charts in Excel

It is possible to create a multi-category chart in Excel (as shown below). The trick is to arrange the data in a certain way, that makes Excel interpret as having multiple categories. Suppose I have the data for the monthly expenses I make on the food items (as listed below). The idea to create a chart …

Read more

How to Create Dynamic Labels in Excel Scroll Bar

I often use scroll bars in an Excel dashboard, which gives a user the freedom to change its values and play with the data. If you have multiple scroll bars in your dashboards, it is helpful to display the current value of each scroll bar. Something as shown below: The idea is to display the value …

Read more

How to Get Unique Items from a List in Excel Using Formulas

In this blog post, I will show you a formula to get a list unique items from a list in excel that has repetitions. While this can be done using Advanced Filter or Conditional Formatting, the benefit of using a formula is that it makes your unique list dynamic. This means that you continue to get …

Read more

Get the FREE 51 Excel Tips Ebook

Enter your details and the free PDF is on its way to your inbox.

Hmm, that didn't go through. Please check your email and try again.

No spam. You'll also get my weekly Excel newsletter. Unsubscribe anytime.

Check your inbox!

The ebook is on its way to your email. It usually lands within a couple of minutes.