

The GAUSS function in Excel returns the probability that a value falls between the average and a point you choose, assuming your data follows a normal distribution, the familiar bell curve.
You pick that point with a z-score, which is the number of standard deviations a value sits from the average. A standard deviation is the typical spread of values around the average.
GAUSS returns the probability as a decimal, so a z-score of 1 gives you 0.3413. The catch is that it only takes z-scores, so raw values like marks or minutes need converting first.
I’ll show you how, along with negative z-scores, grade bands, and the share of values within a range of the average.
Follow along with the example file
GAUSS Function Examples.xlsx
GAUSS Function Syntax
Here is the syntax of the GAUSS function:
=GAUSS(z)
- z – The z-score, which is the number of standard deviations a value sits above or below the average. It is required, and it has to be a number.
At a z-score of 0, you are standing on the average, so GAUSS returns 0. As z grows, the result climbs toward 0.5 but never passes it, because half of all values sit on each side of the average.
If z is text that can’t be read as a number, like “abc” or a cell holding a word, GAUSS returns the #VALUE! error. A number typed as text, like “1.5”, still works.
A blank cell is treated as a z-score of 0, so GAUSS returns 0 for it instead of an error.
The GAUSS function works in Excel 2013 and later, including 365, 2024, 2021, 2019, and 2016.
When to Use the GAUSS Function
Use this function when you need to:
- Find the probability that a value falls between the average and a given z-score.
- Work out what share of a group is expected to sit within a certain distance of the average.
- Find the share of values between two z-scores, such as grade bands on a curve.
- Turn a z-score into a probability without looking it up in a z-table.
Let me show you five practical examples of how to use the GAUSS function.
Example 1: Convert Z-Scores to Probability
Let’s start with a simple example.
Below is a list of exam z-scores for ten students who scored above the class average, and I want to get the probability between the average and each z-score in column C.
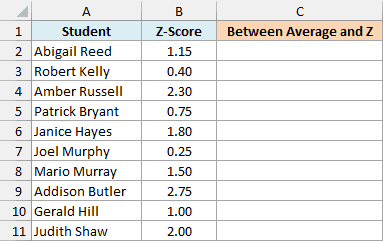
Here is the formula:
=GAUSS(B2:B11)
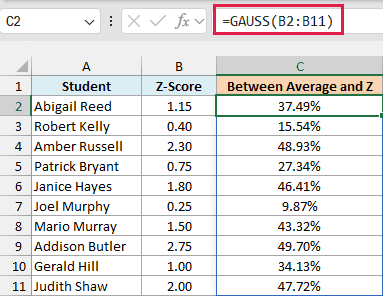
In the above formula, I passed the whole range B2:B11 to GAUSS, so one formula in cell C2 spills the results for all ten students. I formatted column C as a percentage, so Janice’s 0.4641 shows as 46.41%.
That 46.41% is the share of students you would expect to score between the class average and Janice’s score, assuming the scores follow a normal distribution.
You can see the limit of 0.5 at work too. Joel’s z-score of 0.25 gives 9.87%, while Addison’s z-score of 2.75 gives 49.70%, which is almost the 50% maximum.
Behind the scenes, GAUSS(z) is the same as NORM.S.DIST(z,TRUE)-0.5. The NORM.S.DIST function measures the bell curve from its far left edge up to z, while GAUSS starts at the average in the middle.
That is why GAUSS stops at 0.5 while NORM.S.DIST goes all the way to 1.
If you are using Excel 2019 or earlier, enter the below formula in cell C2 and then copy it down the range:
=GAUSS(B2)
If you are using Excel 2010 or earlier, which doesn’t have the GAUSS function, enter the below formula in cell C2 and then copy it down the range:
=NORMSDIST(B2)-0.5
Example 2: Handle Negative Z-Scores with ABS
Now let’s see what happens when the z-score is negative.
Below is a z-score for each day’s step count compared with a person’s usual average, and I want to get the probability between the average and each z-score in column C.
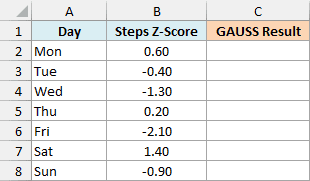
Here is the formula:
=GAUSS(B2:B8)
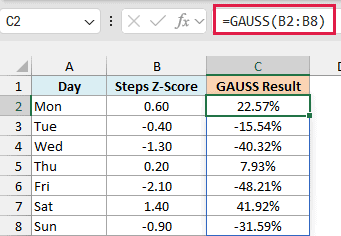
Tuesday, Wednesday, Friday, and Sunday are below average, so their results come back negative. Wednesday’s z-score of -1.30 gives -40.32%.
Important: A probability can’t be negative, so the minus sign only tells you the day was below average. Read -40.32% as 40.32% of days falling between the average and that step count.
If you want the probability as a positive number, wrap the z-scores in the ABS function and put the formula in column D, next to the plain results. Here is the formula:
=GAUSS(ABS(B2:B8))
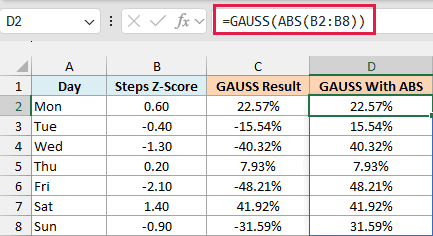
ABS removes the minus sign from each z-score before GAUSS sees it. The bell curve is symmetrical, so the area from the average down to -1.30 is exactly the same as the area from the average up to 1.30.
If you are using Excel 2019 or earlier, enter the below formula in cell D2 and then copy it down the range:
=GAUSS(ABS(B2))
The minus sign that ABS removes isn’t useless, though, and Example 4 puts it to work.
Example 3: Calculate Z-Scores, Then Probabilities
Most of the time nobody hands you z-scores, so let’s start from raw values.
Below are commute times in minutes in column A, along with the average and standard deviation of the daily commute, and I want to get the z-score in column B and the probability in column C.
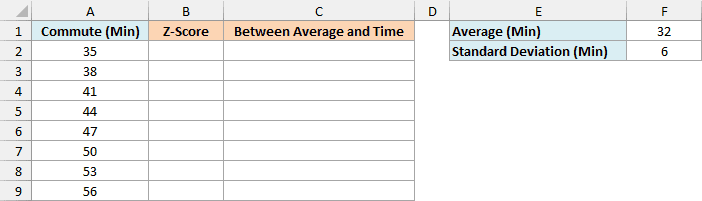
First, I need the z-score for each commute time. Here is the formula:
=STANDARDIZE(A2:A9,F1,F2)
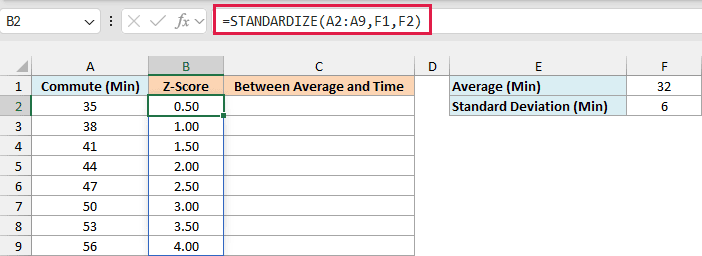
The STANDARDIZE function subtracts the average in F1 from each time and divides by the standard deviation in F2. So a 35-minute commute gives (35-32)/6, which is 0.50 standard deviations above the average.
If you are using Excel 2019 or earlier, enter the below formula in cell B2 and then copy it down the range. The dollar signs keep the average and standard deviation fixed as the formula moves down:
=STANDARDIZE(A2,$F$1,$F$2)
Now I can pass those z-scores to GAUSS. Here is the formula:
=GAUSS(B2:B9)
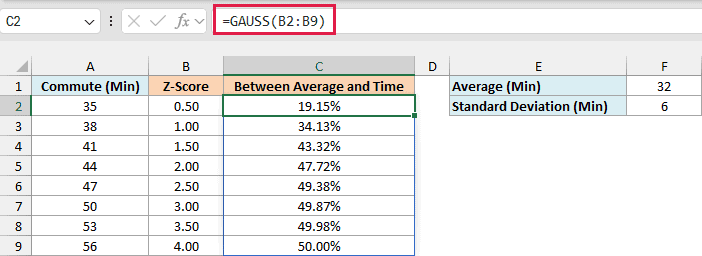
A 44-minute commute has a z-score of 2.00, so GAUSS returns 47.72%. In other words, about 48% of commutes should take between 32 and 44 minutes.
If you are using Excel 2019 or earlier, enter the below formula in cell C2 and then copy it down the range:
=GAUSS(B2)
All of these commutes are longer than the 32-minute average, so every z-score is positive. A time below the average would give a negative result, so wrap the z-scores in ABS as you did in Example 2.
Example 4: Probability Between Two Z-Scores
GAUSS can also give you the probability between any two z-scores, even when the range crosses the average.
Below is a grading curve where each grade has a lower and an upper z-score, and I want to get the share of students who should land in each grade in column D.
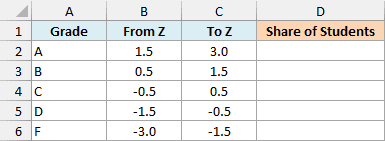
Here is the formula:
=GAUSS(C2:C6)-GAUSS(B2:B6)
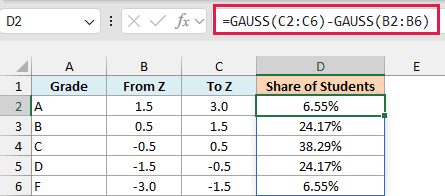
GAUSS(C2:C6) is the area from the average up to each upper z-score, and GAUSS(B2:B6) is the area from the average to each lower z-score. Subtracting the second from the first leaves the area between the two.
This is where the minus sign pays off. For a C, GAUSS(-0.5) is negative, so subtracting it adds the area below the average, which is why the C band comes out at 38.29%.
I used 3 and -3 as the ends of the scale because z-scores beyond them are very rare. For the same reason, the five shares add up to 99.73% instead of exactly 100%.
If you are using Excel 2019 or earlier, enter the below formula in cell D2 and then copy it down the range:
=GAUSS(C2)-GAUSS(B2)
Example 5: Share of Values Within Z Standard Deviations
Finally, let’s find the share of values that sit within a certain distance of the average, on either side.
Below is a list of distances from the average in standard deviations, and I want to get the share of values that fall within that distance, above or below the average, in column B.
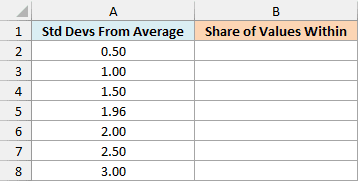
Here is the formula:
=2*GAUSS(A2:A8)
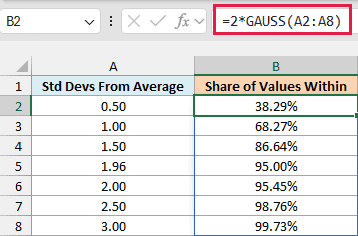
GAUSS covers only one side of the average. The bell curve is symmetrical, so doubling the result covers both sides.
That gives you the well-known 68-95-99.7 rule: 68.27% of values fall within 1 standard deviation, 95.45% within 2, and 99.73% within 3.
The 1.96 in the list is the one people use for a 95% range, and 2*GAUSS(1.96) returns 95.00%.
If you are using Excel 2019 or earlier, enter the below formula in cell B2 and then copy it down the range:
=2*GAUSS(A2)
GAUSS is a small function, but it gets a lot more useful once you pair it with STANDARDIZE and ABS. If you want the probability from the far left of the curve instead, use NORM.S.DIST.
I hope you found this tutorial useful.
Other Excel Articles You May Also Like:
