

The ERF.PRECISE function returns the error function, a math function that comes up in probability and engineering. With a small conversion, it tells you what share of a bell curve’s values fall within a certain distance of the average.
It takes one number and gives back a result between -1 and 1. Here I’ll show you how that conversion works, including how to find the share of bottles that land within an allowed margin of their target volume.
Follow along with the example file
ERF.PRECISE Function Examples.xlsx
ERF.PRECISE Function Syntax
Here is the syntax of the ERF.PRECISE function:
=ERF.PRECISE(x)
- x is required. It is the number you want the error function for.
Under the hood, Excel adds up the area under a curve from 0 up to x, but you don’t need that to use the function.
Negative numbers work too, and they flip the sign of the result. For example, =ERF.PRECISE(1) returns 0.84270079, and =ERF.PRECISE(-1) returns -0.84270079.
The result never goes past 1 or below -1. Once x reaches about 6, Excel returns exactly 1 (or -1 for a negative x).
If x is text or a TRUE/FALSE value, the function returns the #VALUE! error. An empty cell counts as 0, so it returns 0.
The older ERF function takes an optional second number. ERF.PRECISE takes exactly one, and Excel won’t accept a second argument when you type the formula.
The ERF.PRECISE function works in Excel 2010 and later, including 365, 2024, 2021, 2019, 2016, and Mac.
When to Use the ERF.PRECISE Function
Use this function when you need to:
- Use the error function inside an engineering or physics formula.
- Turn a distance from the average into the share of values that fall inside it on a bell curve.
- Find the share of products that land within an allowed margin (tolerance) of a target.
- Find the share of values between two limits, such as an exam score band.
- Check your results against the NORM.S.DIST function, which reaches the same answer another way.
Let me show you a few practical examples of how to use this function.
Example 1: Calculate the Error Function for a List of Numbers
Let’s start with a plain list of numbers.
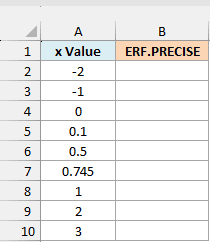
Below is a list of numbers in column A, and I want to get the error function for each one in column B.
Here is the formula:
=ERF.PRECISE(+A2:A10)
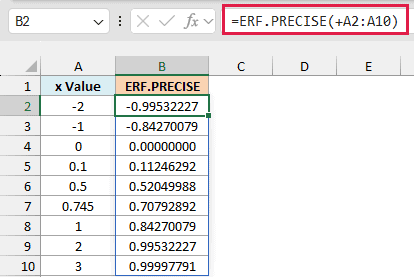
The formula spills nine results from B2 to B10. For 1, it returns 0.84270079, the same value Microsoft’s own page shows.
That number means 84.27% of the values on a bell curve fall within 1.41 standard deviations of the average. A standard deviation is a measure of how much the values typically vary.
The 1.41 is 1 times the square root of 2, and Example 2 shows how to use this.
Notice how the values climb toward 1 as the number grows. At 3 you are already at 0.99997791, and the negative numbers mirror the positive ones with the sign flipped.
The plus sign in front of A2:A10 asks Excel to pass the values in the range as a list. It doesn’t change them in any way.
Important: Keep the plus sign in front of the range. Without it, the ERF.PRECISE function returns #VALUE! when you give it a plain range, even in Excel 365.
I’ve formatted column B to show eight decimal places, but Excel keeps more digits behind the scenes.
If you are using Excel 2019 or earlier, enter the below formula in cell B2 and then copy it down the range:
=ERF.PRECISE(A2)
Example 2: Find the Share of Bottles Within Tolerance
Now let’s use the function on a real-world scenario.
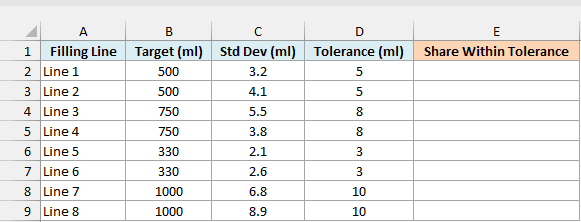
Below is a list of bottle-filling lines with the target volume, the standard deviation of the fills (how much they typically vary), and the allowed tolerance, and I want to get the share of bottles within tolerance in column E.
Here is the formula:
=ERF.PRECISE(D2:D9/(C2:C9*SQRT(2)))
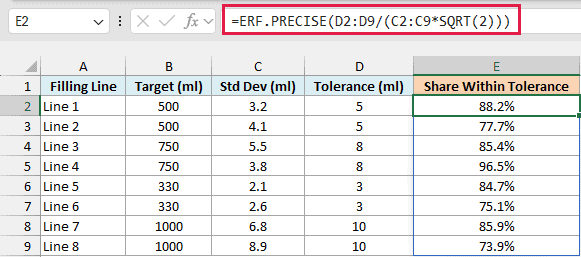
This assumes the fills follow a bell curve centered on the target volume. Here is how the formula works:
C2:C9*SQRT(2)multiplies each standard deviation by the square root of 2, because the error function measures distance in those units (Example 4 shows where that factor comes from).D2:D9/(...)divides each tolerance by that value, which gives the x that goes into the function.- ERF.PRECISE then returns the share of bottles that land within that distance on either side of the target.
So Line 1 puts an estimated 88.2% of its bottles within 5 ml of the 500 ml target, while Line 8 manages only 73.9% within 10 ml of 1000 ml.
The target volume sits in the table but not in the formula. With the bell curve centered on the target, only the size of the tolerance compared to the standard deviation changes the answer.
The range here doesn’t need a plus sign, because the division inside the formula already turns the ranges into lists.
If you are using Excel 2019 or earlier, enter the below formula in cell E2 and then copy it down the range:
=ERF.PRECISE(D2/(C2*SQRT(2)))
Example 3: Get the Share Between Two Limits
Let’s step it up with a score band that isn’t centered on the average.
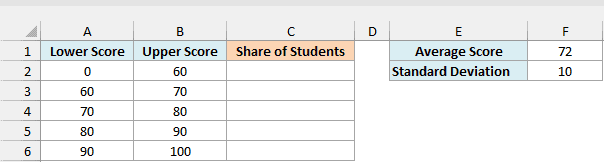
Below is a list of exam score bands in columns A and B, with the class average in F1 and the standard deviation in F2, and I want the estimated share of students in each band in column C.
Here is the formula:
=(ERF.PRECISE((B2:B6-F1)/(F2*SQRT(2)))-ERF.PRECISE((A2:A6-F1)/(F2*SQRT(2))))/2
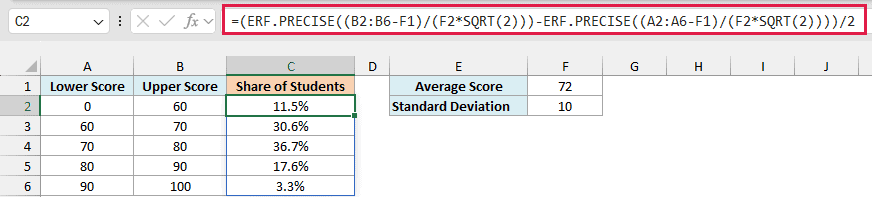
ERF.PRECISE has only one limit, so you can’t give it both ends of a band. Instead, you calculate it for the upper score and for the lower score, and subtract one from the other.
I’m assuming the scores follow a bell curve. Column A holds the lower score of each band and column B holds the upper score.
Here is how this formula works:
(B2:B6-F1)/(F2*SQRT(2))turns each upper score into the x value the function needs, using the average in F1 and the standard deviation in F2.- The second ERF.PRECISE does the same for the lower scores in A2:A6.
- Each result counts the share on both sides of the average, like the shares in Example 2, so it is double the share between the average and that score. Dividing the difference by 2 gives the share between the two scores.
A score below the average returns a negative result, and the subtraction takes care of that.
The estimated share is highest for the 70 to 80 band at 36.7%. The five bands add up to 99.7% rather than 100%, because a bell curve has no hard ceiling and a small tail lies above 100.
Pro Tip: If all you need is the share between two scores, the NORM.DIST function does it with less math, because it takes the average and standard deviation directly.
If you are using Excel 2019 or earlier, enter the below formula in cell C2 and then copy it down the range:
=(ERF.PRECISE((B2-$F$1)/($F$2*SQRT(2)))-ERF.PRECISE((A2-$F$1)/($F$2*SQRT(2))))/2
Example 4: Check ERF.PRECISE Against NORM.S.DIST
Finally, let me show you how this function connects to the normal distribution functions you may already know.
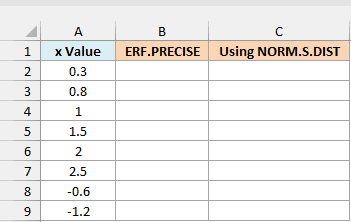
Below is a list of numbers in column A, and I want to calculate the error function in column B and then reproduce the same values with the NORM.S.DIST function in column C.
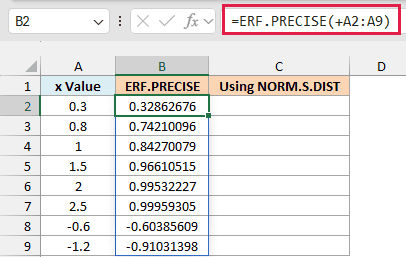
Here is the ERF.PRECISE formula:
=ERF.PRECISE(+A2:A9)
And here is the same result built from NORM.S.DIST:
=2*NORM.S.DIST(A2:A9*SQRT(2),TRUE)-1
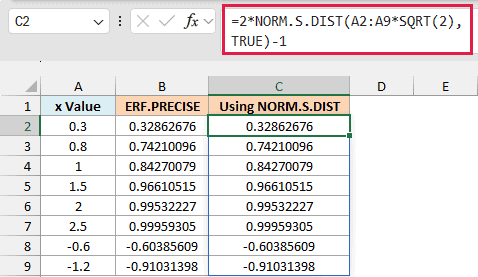
NORM.S.DIST returns the share of values below a point on the standard bell curve (average 0, standard deviation 1), and TRUE asks for that running total.
Multiply the number by the square root of 2, double the share, and subtract 1, and you land on the error function.
Both columns show the same value in every row, even for the negative numbers. That is the link between the two functions, and it is where the square root of 2 in Examples 2 and 3 comes from.
It is also handy when you want to double-check an ERF.PRECISE result.
If you are using Excel 2019 or earlier, enter the below formula in cell C2 and then copy it down the range:
=2*NORM.S.DIST(A2*SQRT(2),TRUE)-1
So these are the ways you can use the ERF.PRECISE function. In most cases it comes down to finding the share of values near the center of a bell curve, and the NORM.S.DIST check from Example 4 is a quick way to confirm the result.
If you need two limits in one function, the ERF function takes them, and ERFC.PRECISE returns the share left outside, which is 1 minus the ERF.PRECISE result.
Other Excel Articles You May Also Like:
