

The ERFC function in Excel returns the complementary error function, which is 1 minus the result of the ERF function. Put simply, it tells you how much of a bell curve sits beyond a point, which is handy for tail questions.
Below, I’ll show you how ERFC works with positive and negative numbers, why it beats 1-ERF for very small values, and how to use it on real questions.
ERFC does have a catch. It won’t take a whole range, so =ERFC(A2:A10) returns #VALUE!, and I’ll show you how to work around that.
Follow along with the example file
ERFC Function Examples.xlsx
ERFC Function Syntax
Here is the syntax of the ERFC function:
=ERFC(x)
- x – How far from the center the tail starts. ERFC returns how much of its own bell curve lies beyond that distance, counting both sides of the center.
That bell curve is narrower than the standard normal curve. So to measure a distance in standard deviations, divide it by SQRT(2) before passing it to ERFC, as Example 4 shows.
ERFC returns 1 when x is 0, because that counts the whole curve. The result gets smaller as x gets bigger, and it never drops below 0.
Negative numbers work too. They return results between 1 and 2, and you’ll see how that plays out in Example 2.
If x is text that isn’t a number, ERFC returns a #VALUE! error. A blank cell counts as 0, so it returns 1.
The ERFC function works in Excel for Microsoft 365, Excel 2024, 2021, 2019, and 2016.
When to Use the ERFC Function
Use this function when you need to:
- Find the share of values that fall beyond a limit when your data follows a bell curve
- Get a tail probability for a number of standard deviations from the average
- Calculate very small tail values where 1-ERF loses accuracy
- Work with science or engineering formulas written in terms of the complementary error function
Let me show you a few practical examples of how to use the ERFC function in Excel.
Example 1: Calculate ERFC for a List of Numbers
Let’s start with a simple example.
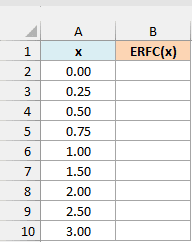
Below is a list of numbers from 0 to 3, and I want to get the ERFC value of each one in column B.
Here is the formula:
=ERFC(A2)
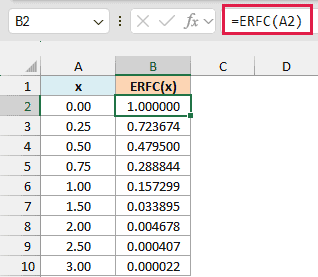
ERFC(0) returns 1, and the results shrink as the number grows. For 1 you get 0.157299, and for 3 you get 0.000022.
We’re keeping this as a per-row formula, so enter it in B2 and copy it down the column.
Important: ERFC doesn’t accept a range. =ERFC(A2:A10) returns a #VALUE! error even in Excel 365, where most functions spill, so use the per-row formula here.
Example 2: ERFC With Negative Numbers
Now let’s see what happens when the number is negative.
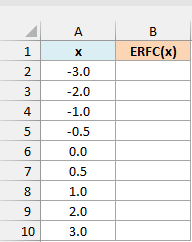
Below is a list of numbers from -3 to 3, and I want to get the ERFC value of each one in column B.
Here is the formula:
=ERFC(A2)
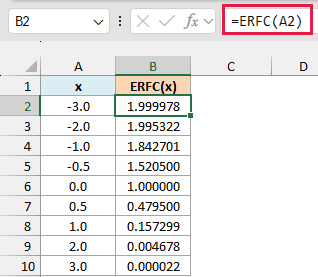
Negative numbers don’t cause an error, and the results land between 1 and 2. ERFC(-1) is 1.842701, and ERFC(-3) is 1.999978, which is very close to the maximum of 2.
There’s a neat pattern here. The result for a number and the result for the same number with its sign flipped should add up to exactly 2.
Here is a formula in column C that checks it:
=ERFC(A2)+ERFC(-A2)
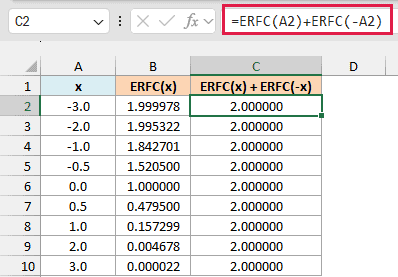
Every row returns 2, because ERFC(-x) always equals 2 minus ERFC(x). So if you know the result for a positive number, you already know it for the negative one.
Example 3: ERFC vs 1-ERF for Very Small Values
Since ERFC is just 1 minus ERF, you might wonder why Excel has it at all.
Below is a list of larger numbers in column A, and I want to get the tail value of each one in column B using ERFC.
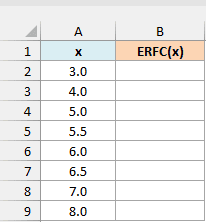
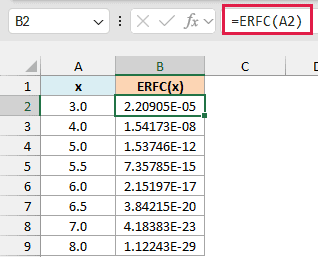
Here is the formula:
=ERFC(A2)
Now here is the 1-ERF version in column C, to compare:
=1-ERF(A2)
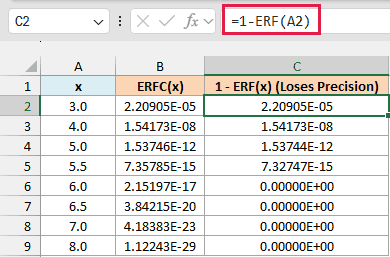
Excel shows these in scientific notation, so 1.53746E-12 means 1.53746 times 10 to the power of -12.
At 3 and 4 the two columns match. At 5, ERFC returns 1.53746E-12 while 1-ERF returns 1.53744E-12, so the last digits are already off.
By 6, ERF(6) is so close to 1 that Excel stores it as exactly 1. The subtraction then leaves 0, even though the real value is about 2.15E-17.
Important: From about 6 upward, 1-ERF(x) returns 0 instead of the real tail value. Use ERFC whenever you need very small tail values.
Example 4: Share of Days Beyond a Number of Standard Deviations
Now let’s use ERFC on a real question.
Say a coffee shop’s daily customer count follows a bell curve around its average.
Below is a list of distances from that average, counted in standard deviations, and I want the share of days that land at least that far away, above or below, in column B.
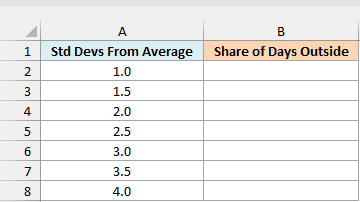
Here is the formula:
=ERFC(A2:A8/SQRT(2))
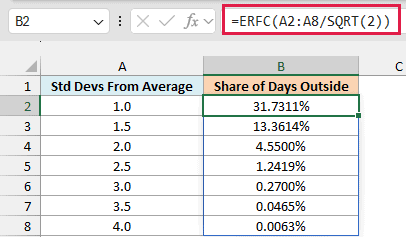
Here is how this formula works:
- A2:A8/SQRT(2) converts each distance in standard deviations to ERFC’s own scale, which is narrower than the standard bell curve.
- ERFC returns the share of days beyond that distance, counting both the busy side and the slow side.
At 2 standard deviations, 4.5500% of days land outside. At 3, it’s only 0.2700%.
This is one formula in B2 that spills down to B8. ERFC rejects a bare range, but it spills fine here because its argument is a calculation on the range.
To turn each share into “one day in every N days”, divide 1 by it. Here is the formula for column C:
=1/B2:B8
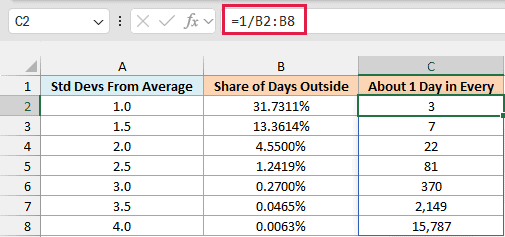
At 3 standard deviations, it’s about one day in every 370. At 4, it’s about one day in every 15,787.
If you are using Excel 2019 or earlier, enter the below formula in cell B2 and then copy it down the range:
=ERFC(A2/SQRT(2))
The same goes for column C. If you are using Excel 2019 or earlier, enter the below formula in cell C2 and then copy it down the range:
=1/B2
Example 5: Find the Share Below a Warranty Length
Let’s look at the one-sided version of the same idea.
Below is a list of battery types with the average life, the standard deviation, and the warranty length, all in months, and I want the share that fail before the warranty ends in column E. I’m assuming the lifetimes follow a bell curve.
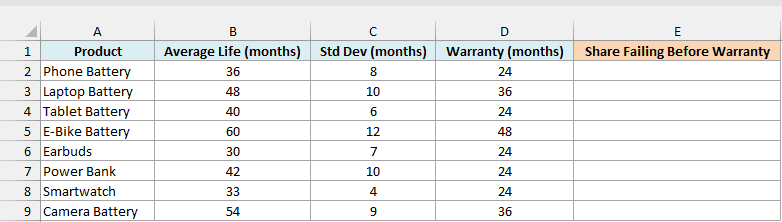
Here is the formula:
=ERFC((B2:B9-D2:D9)/(C2:C9*SQRT(2)))/2
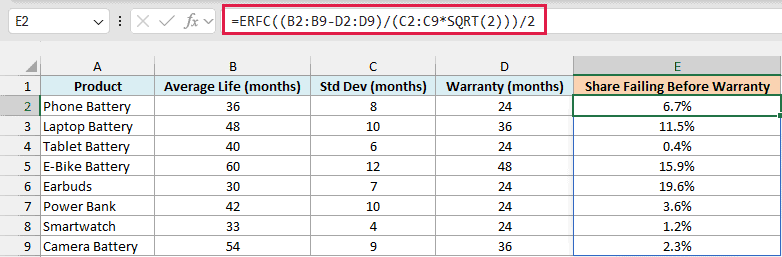
Here is how this formula works:
- B2:B9-D2:D9 is how many months the warranty (column D) falls short of the average life (column B).
- /(C2:C9*SQRT(2)) divides that gap by the standard deviation in column C, and applies the same SQRT(2) conversion as Example 4.
- ERFC(…)/2 keeps only the early-failure side, because ERFC counts both ends and we only want one.
So 6.7% of the phone batteries fail before their 24-month warranty ends, while only 0.4% of the tablet batteries do.
The NORM.DIST function reaches the same shares with a shorter formula. Give it the warranty, then the average life and the standard deviation, and finish with TRUE.
If you are using Excel 2019 or earlier, enter the below formula in cell E2 and then copy it down the range:
=ERFC((B2-D2)/(C2*SQRT(2)))/2
So these are five ways to use the ERFC function in Excel. It returns how much of its bell curve lies beyond a point, accepts negative numbers, and keeps very small tail values accurate where 1-ERF returns 0.
Excel also has an ERFC.PRECISE function. It takes the same single x argument, and in my checks in Excel 365 it returned identical results to ERFC.
I hope you found this tutorial useful.
Other Excel Articles You May Also Like:
