

With the GROUPBY function in Excel, you can summarize your data by category using a single formula. You don’t need a PivotTable, and the summary recalculates when the source data changes.
It only works in Microsoft 365.
In this article, I’ll show you how to use GROUPBY in Excel to sum, average, count, group dates, and combine text.
Follow along with the example file
GROUPBY Function Examples.xlsx
Excel GROUPBY Function Syntax
Here is the syntax of the GROUPBY function:
=GROUPBY(row_fields,values,function,[field_headers],[total_depth],[sort_order],[filter_array],[field_relationship])
- row_fields is the column or columns you want to group by. These become the row labels. You can also supply calculated labels, as we’ll do with dates in Example 4.
- values is the column or columns you want to calculate something from, such as prices to add or names to count.
- function tells GROUPBY what calculation to run for each group. Write the function name on its own, like
SUM, notSUM(). Other choices include AVERAGE, COUNT, MEDIAN, MIN, MAX, PERCENTOF, and ARRAYTOTEXT. - field_headers is optional. Use
0when the ranges have no headers,1when they have headers but you want to hide them,2when they have no headers but you want generated ones, or3to show the source headers. Omit it for automatic detection. - total_depth is optional. Omit it and you get a grand total. Use
0for no totals,1for a grand total, or2for a grand total and subtotals (this needs at least two grouping columns). Use-1or-2to show the same totals at the top. - sort_order is optional. It points at an output column, counting the grouping columns first, then the value columns. A positive number sorts ascending; a negative number sorts descending. By default, GROUPBY sorts the row labels A to Z.
- filter_array is optional. It’s a column of TRUE/FALSE results, one per source row. GROUPBY includes TRUE rows before grouping. It must have the same number of rows as row_fields.
- field_relationship is optional and only matters with multiple grouping columns. Use
0(the default) for a hierarchy, with later columns grouped inside earlier ones. Use1for table mode, where columns sort independently and subtotals aren’t available.
The first three arguments are all you need for most summaries. The other five are switches you turn on when you want more control.
If you’re on Excel 2024, Excel 2021, or an older version, you’ll get a #NAME? error, as GROUPBY isn’t available there.
When to Use the GROUPBY Function
Use GROUPBY when you need to:
- Build a summary grouped by a category, all from one formula.
- Get sums, averages, counts, or text lists per group without a PivotTable.
- Group dates by month or year without adding a helper column.
- Create a summary with multiple grouping levels and subtotals.
- Keep a summary that recalculates when the source data changes.
Let me show you a few practical examples of how this works.
Example 1: Group and Sum Data by Category
Let’s start with a simple example.
Below is a list of ten grocery items and their prices, and I want total spend for each aisle in columns E and F.
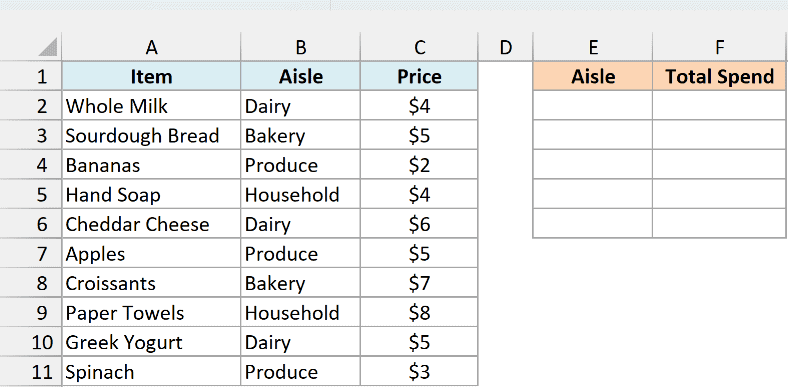
Here is the formula:
=GROUPBY(B2:B11,C2:C11,SUM)
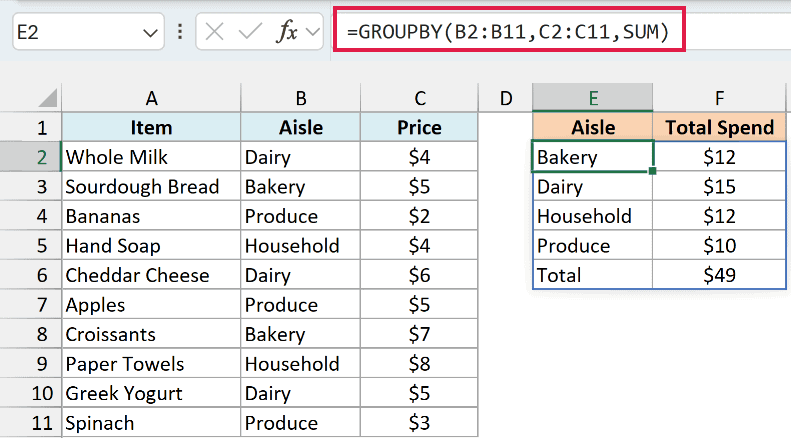
Here, the first argument (B2:B11) is the Aisle column I want to group by, the second (C2:C11) is the Price column I want to add up, and SUM tells GROUPBY to total each group.
The result spills into E2:F6. Each aisle shows up once with its total next to it: Bakery $12, Dairy $15, Household $12, and Produce $10.
The aisles come out sorted A to Z automatically. You also get a Total row at the bottom that adds up to $49.
GROUPBY adds that Total row by default. Set total_depth to 0 to remove it, as you’ll see in Example 6.
Notice that I did not touch the Item column at all. GROUPBY only cares about the columns you hand it.
Anything already in E2:F6 blocks the result and causes a #SPILL! error, so keep that area empty before entering the formula.
Pro Tip: If your data is in an Excel Table, use its column references so new rows are included automatically. Just put the formula outside the table, as a spilling formula can’t go inside one.
Example 2: Average per Group with Source Headers
Here’s another practical scenario.
Below are 12 test scores, and I want the average score for each subject, with the source headers included, in columns E and F.
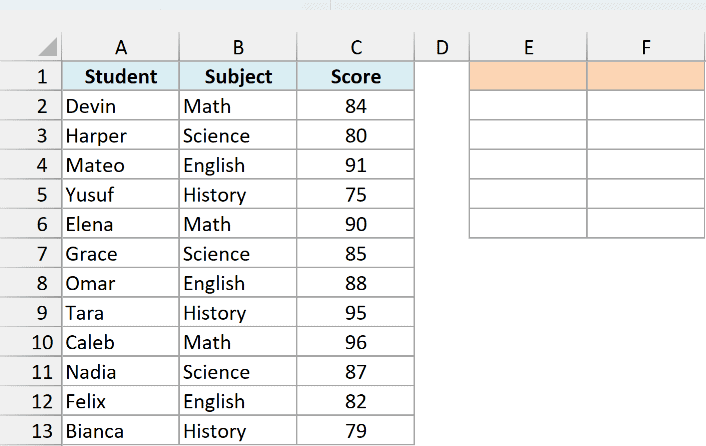
Here is the formula:
=GROUPBY(B1:B13,C1:C13,AVERAGE,3)
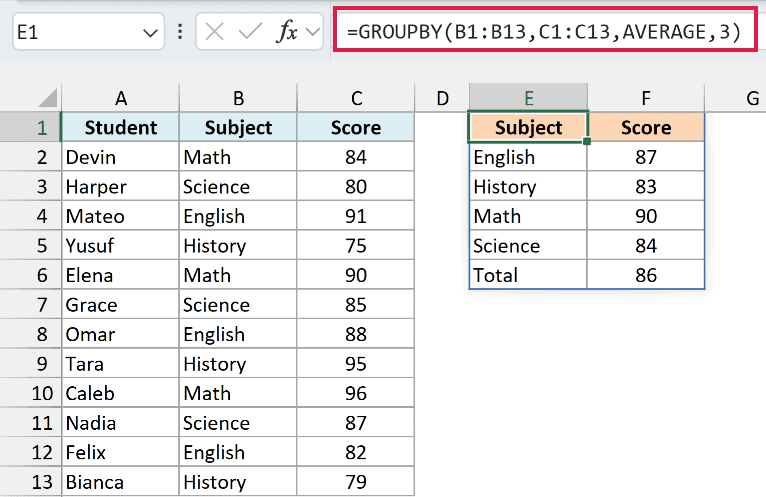
This time, the ranges start at row 1, so they include the Subject and Score headers. AVERAGE tells GROUPBY to average the scores in each subject.
The 3 is field_headers. It tells GROUPBY that the source ranges have headers and that those headers should appear in the result.
E1:F1 shows Subject and Score. Below that come English 87, History 83, Math 90, and Science 84, followed by Total 86.
If you leave field_headers out, GROUPBY still spots that the first row has headers, but it doesn’t show them in the result. That’s why I used 3 here.
When the headers matter, set field_headers yourself instead of relying on auto-detection.
The Total row averages all 12 original scores: 1032 divided by 12 gives 86.
It equals the average of the four subject averages here because each subject has three scores. With uneven group sizes, those two averages can differ.
Example 3: Count Items in Each Group
Now let’s look at something a little different.
I have a list of 12 gym members, and I want to count how many are on each plan in columns E and F.
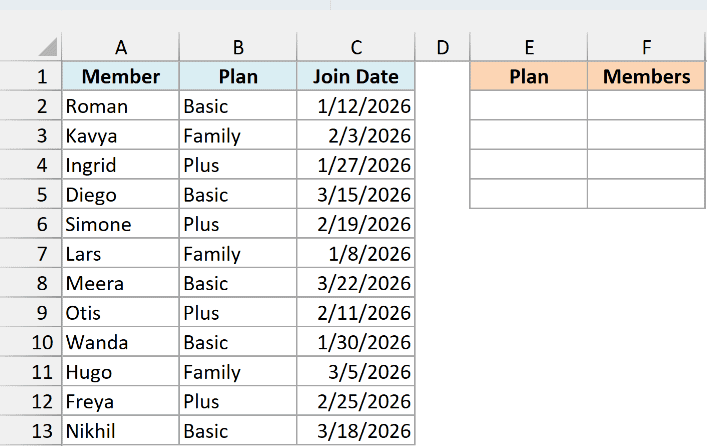
Here is the formula:
=GROUPBY(B2:B13,A2:A13,COUNTA)
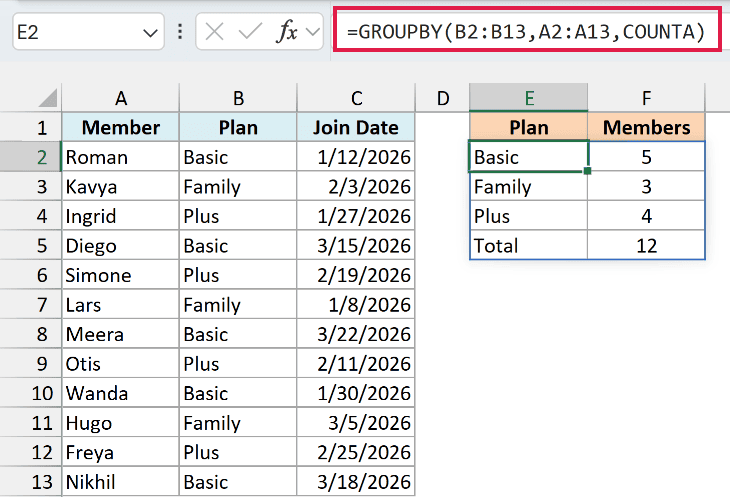
This time I grouped by the Plan column (B2:B13) and pointed the values at the Member column (A2:A13). COUNTA counts the names in each group.
The result in E2:F5 shows Basic 5, Family 3, and Plus 4, with a Total of 12.
There is a reason I used COUNTA here and not COUNT. COUNTA counts non-empty cells, including names.
COUNT only counts numbers, so pointing it at this column of names would return 0 for every group.
Example 4: Group Dates by Month with GROUPBY
Let’s group dates next, without adding a helper column.
Below are 12 cake orders from a home bakery, and I want total cake sales for each month in columns E and F.
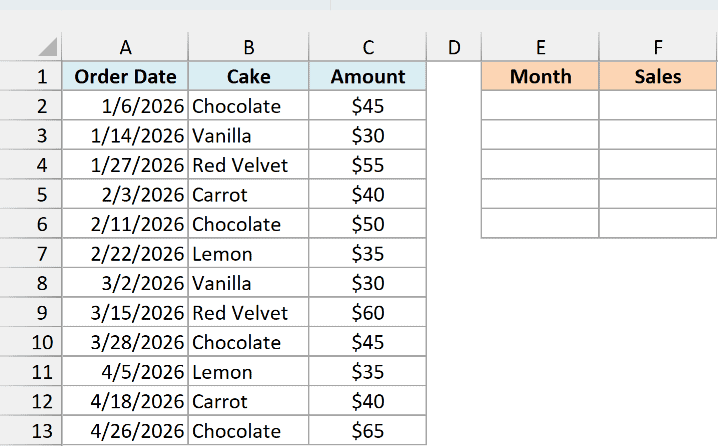
Here is the formula:
=GROUPBY(TEXT(A2:A13,"yyyy-mm"),C2:C13,SUM)
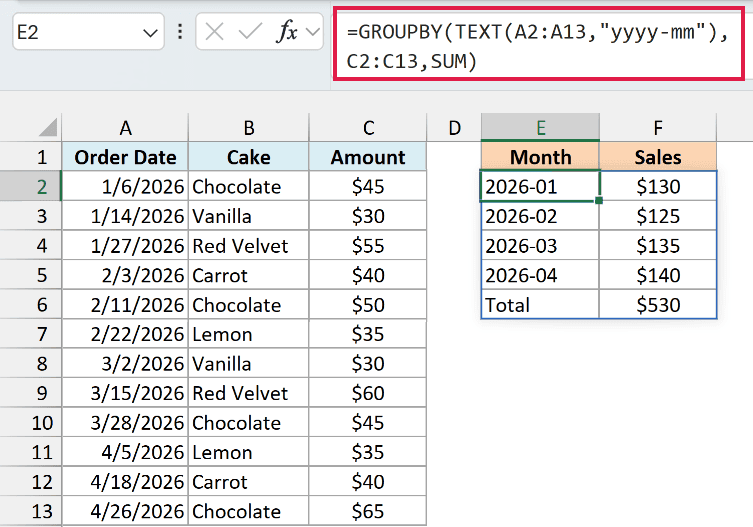
The result in E2:F6 shows 2026-01 $130, 2026-02 $125, 2026-03 $135, and 2026-04 $140. The Total row is $530.
Here is how this formula works:
- TEXT converts each date in A2:A13 into a year-month label using
"yyyy-mm". - GROUPBY uses those calculated labels as row_fields. This argument doesn’t have to be a range of cells already on the sheet.
C2:C13supplies the order amounts, and SUM adds them for each month.
If you want totals by year instead of month, use TEXT(A2:A13,"yyyy") as the first argument.
The month labels from the TEXT function are text. If you need real dates for date math, use DATE(YEAR(A2:A13),MONTH(A2:A13),1) as row_fields instead.
Then format E2:E5 with the custom number format mmm yyyy to show those dates as labels like Jan 2026.
Important: If you use TEXT(A2:A13,"mmm") for the labels instead, GROUPBY sorts the month names alphabetically (Apr, Feb, Jan, Mar). “yyyy-mm” keeps them in date order.
Example 5: GROUPBY with Multiple Columns and Subtotals
Let’s step it up with two grouping levels.
I have ten clothing store orders, and I want totals by department and category, with department subtotals, in columns F, G, and H.
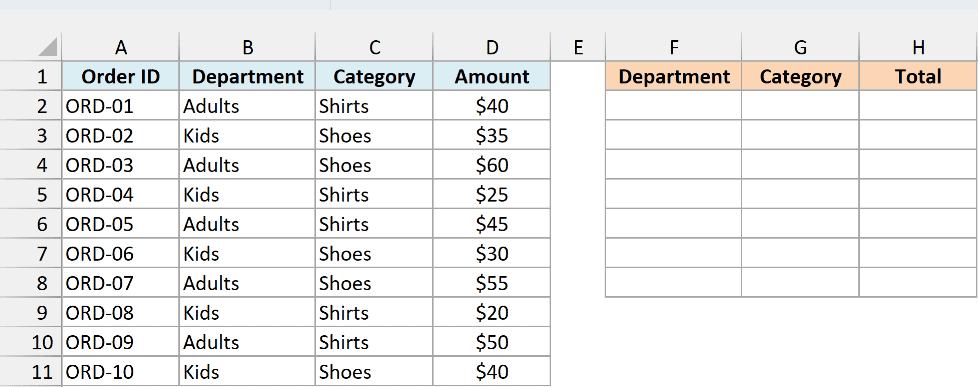
Here is the formula:
=GROUPBY(B2:C11,D2:D11,SUM,0,2)
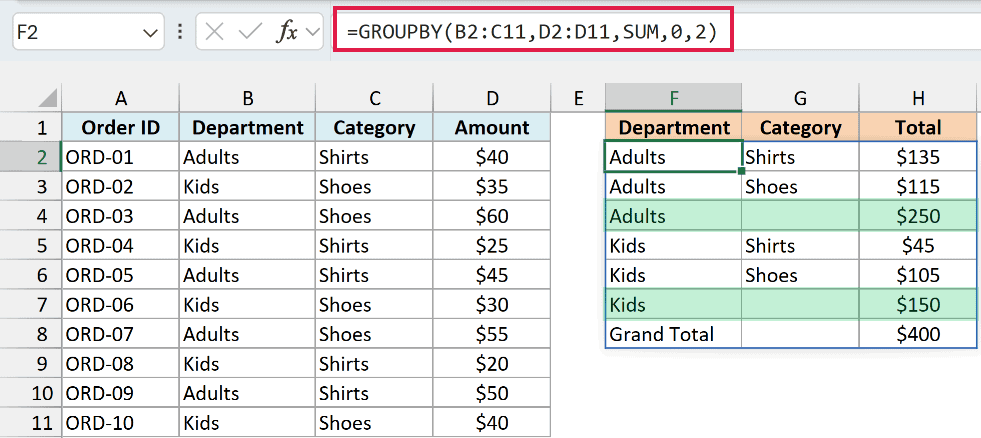
Here is how this formula works:
B2:C11covers two grouping columns. GROUPBY groups by Department first, then by Category inside each department.D2:D11supplies the order amounts, and SUM adds them for each Department and Category combination.0is field_headers. The selected source ranges start at row 2, so they don’t include a header row.2is total_depth. It asks for department subtotals and a grand total.
Each department’s categories are followed by a subtotal row (Adults $250 and Kids $150), and the Grand Total of $400 sits at the bottom.
The subtotal and Grand Total rows leave the Category column blank.
If you want the largest category amounts first, set sort_order to -3, because the amount is output column 3.
This sorts categories by amount, largest first, within each department. Departments stay in A to Z order.
Note that subtotals only work with two or more grouping columns, like we have here. With a single grouping column, setting total_depth to 2 returns #VALUE!.
If your grouping columns weren’t next to each other, you could combine them with the HSTACK function, or pick them with the CHOOSECOLS function, for the row_fields argument.
Example 6: Filter and Sort the GROUPBY Summary
This next one uses two of the optional arguments together.
Below is a watchlist of 12 movies, and I want the highest rating per genre for movies marked Yes under Watched?, sorted highest first, in columns F and G.
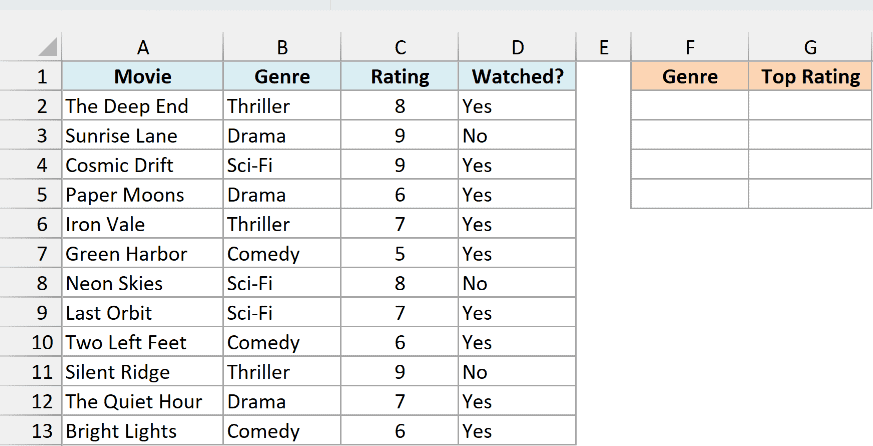
Here is the formula:
=GROUPBY(B2:B13,C2:C13,MAX,0,0,-2,D2:D13="Yes")
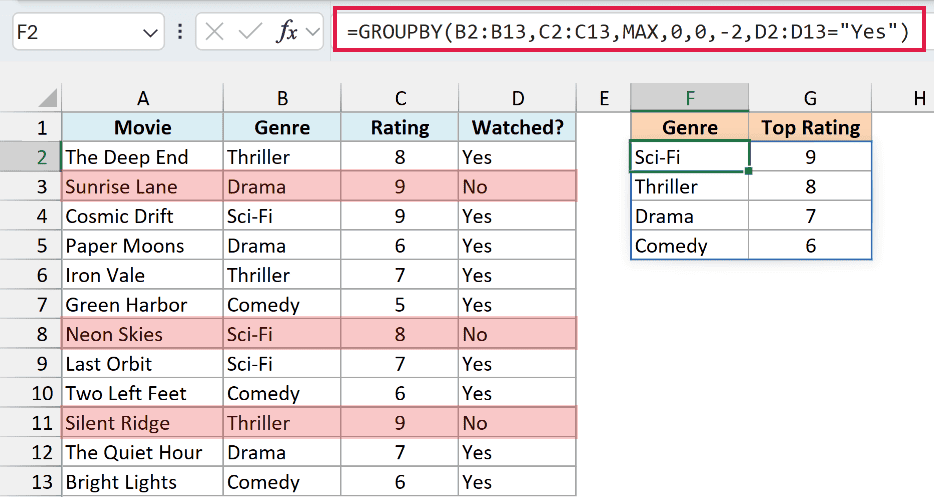
The result in F2:G5 gives Sci-Fi 9 at the top, then Thriller 8, Drama 7, and Comedy 6. The movies marked No never enter the calculation.
Here is how this formula works:
B2:B13supplies the genres, andC2:C13supplies the ratings. MAX returns the highest included rating in each genre.- The first
0sets field_headers, because the selected ranges don’t include headers. - The second
0sets total_depth, turning off the Total row. A grand maximum across genres isn’t needed for this list. -2sets sort_order to the second output column, the rating, from largest to smallest. Count output positions, not source columns.D2:D13="Yes"is filter_array. It returns TRUE for watched movies and FALSE for the rest, so only watched rows reach GROUPBY.
Silent Ridge (Thriller 9) and Sunrise Lane (Drama 9) are both unwatched. Without the filter, Thriller and Drama would each show 9.
The filter_array screens source rows before grouping. It can’t hide groups based on their finished totals.
To filter the finished summary instead, wrap the result in FILTER.
Example 7: Run Several Calculations at Once
Now let’s get more than one calculation for each group.
Below are 12 household bills, and I want the total, average, and share of all spending for each bill type in columns E, F, G, and H.
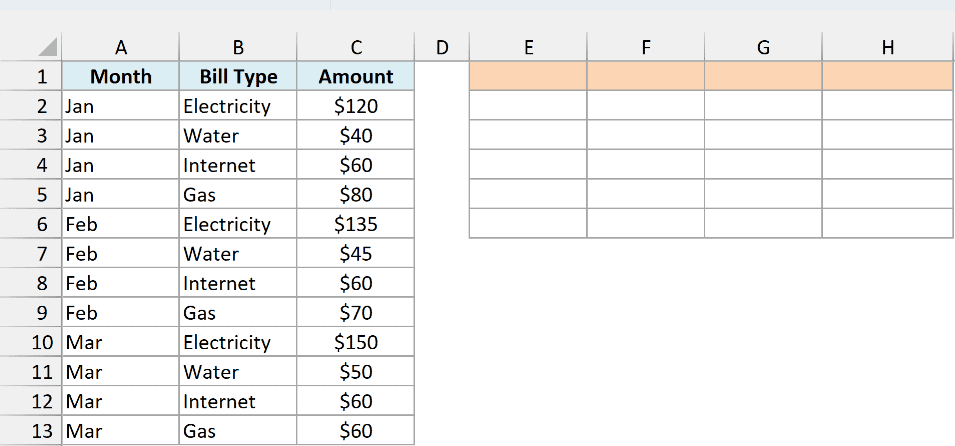
Here is the formula:
=GROUPBY(B2:B13,C2:C13,HSTACK(SUM,AVERAGE,PERCENTOF),0)
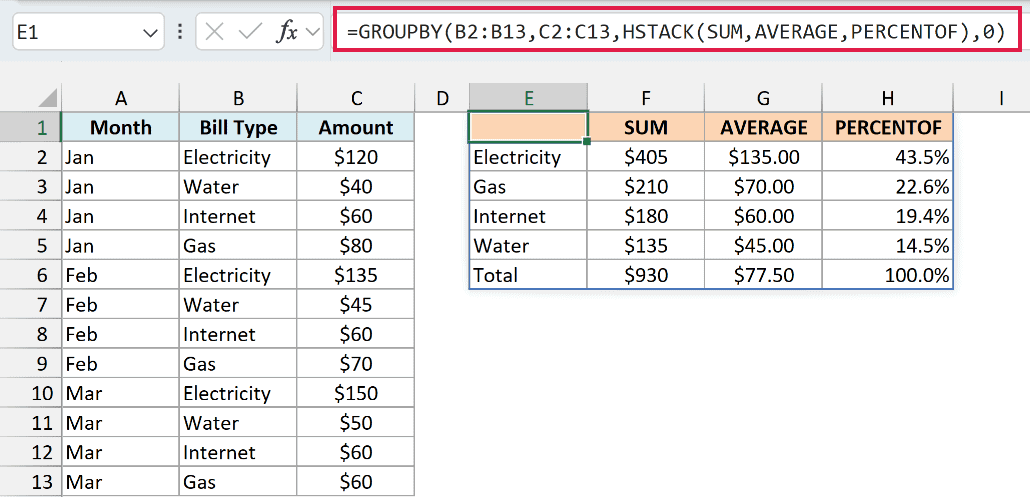
Here is how this formula works:
B2:B13groups the bills by Bill Type, andC2:C13supplies the amounts. The Month column isn’t used.HSTACK(SUM,AVERAGE,PERCENTOF)supplies three functions side by side. GROUPBY runs all three for each bill type.- SUM gives each bill type’s total. AVERAGE gives its average bill, and PERCENTOF gives its share of the grand total.
0is field_headers, because the selected source ranges don’t include headers.
Since there are three functions, GROUPBY adds its own labels in F1:H1 (SUM, AVERAGE, and PERCENTOF) and leaves E1 blank. It does this even though field_headers is set to 0.
For example, Electricity shows a total of $405, an average bill of $135.00, and 43.5% of all spending.
The Total row shows $930, $77.50, and 100.0%. Its AVERAGE is the average of all 12 original bills.
HSTACK puts the calculations side by side. If you want them stacked as extra rows under each group instead, use the VSTACK function.
If you need a calculation of your own, GROUPBY also accepts a custom LAMBDA function, as I’ll show in Example 8.
Pro Tip: GROUPBY returns plain numbers, so format F2:F6 as currency, G2:G6 as currency with two decimals, and H2:H6 as percentages. Formatting stays when the data updates.
Example 8: Combine Text by Group
Let’s finish by grouping names into text lists.
I have 12 party RSVPs, and I want one comma-separated list of guest names for each answer in columns D and E.
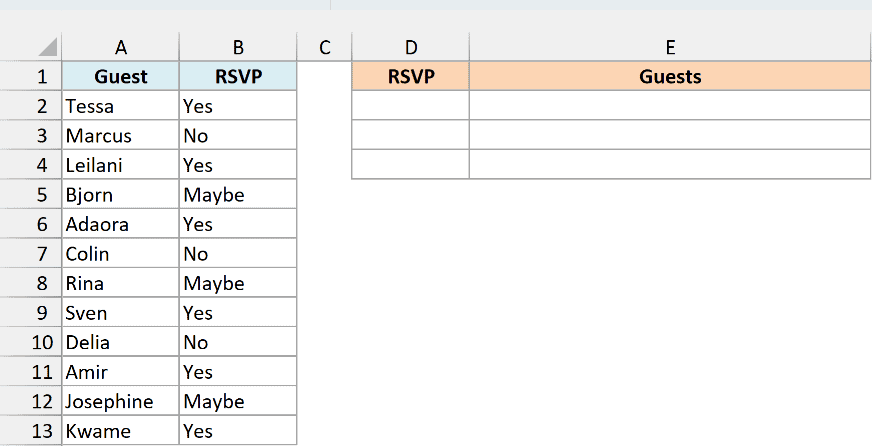
Here is the formula:
=GROUPBY(B2:B13,A2:A13,ARRAYTOTEXT,0,0)
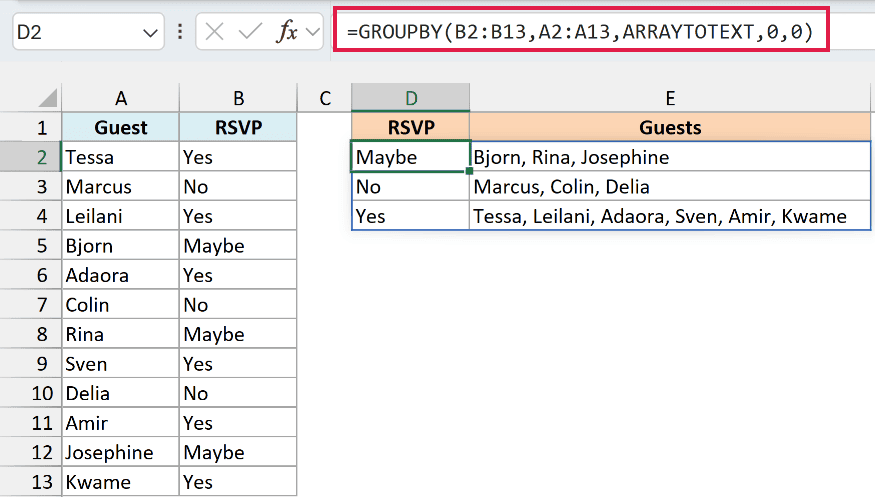
GROUPBY isn’t only for numbers. Here it groups by RSVP in B2:B13 and passes each group’s names from A2:A13 to ARRAYTOTEXT.
ARRAYTOTEXT joins the names with a comma and a space, keeping them in source order within each group.
For example, Maybe gives “Bjorn, Rina, Josephine”. The three RSVP groups fill D2:E4.
The two zeros set field_headers and total_depth to 0. There are no formula-generated headers and no Total row combining all the names.
For a different separator, pass your own LAMBDA as the function argument.
For example, to separate the names with a pipe ( | ), replace the formula in D2 with this one:
=GROUPBY(B2:B13,A2:A13,LAMBDA(x,TEXTJOIN(" | ",TRUE,x)),0,0)
The LAMBDA receives each group’s names as x, and TEXTJOIN joins them using that separator.
In this article, I showed you how to use GROUPBY to sum, average, count, group dates by month, and add subtotals.
I also covered filtering and sorting, running several calculations at once, and combining text by group.
The PIVOTBY function is GROUPBY’s sibling. Use it when you also want groups spread across columns.
I hope you found this article helpful.
Other Excel Articles You May Also Like:
