As the world goes crazy (including me) over the new season of Game of Thrones, I thought it would be a good idea to visualize its data by creating an Excel Dashboard.
Using my substandard secondary skills, I was somehow able to find enough data points to create an awesome Excel dashboard. There are many wonderful people/forums/wikis that helped me compile this dataset (credits at the end).
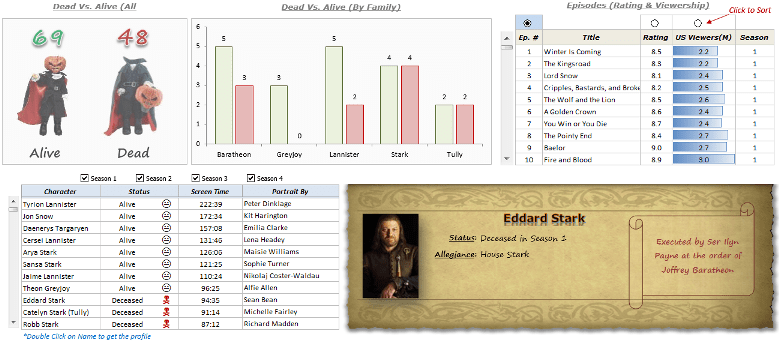
Here is how the final Dashboard looks like:
Give me the Dashboard right away (~17 MB)
Learn to Create World Class Dashboards in Excel. Join the Excel Dashboard Course.
Data Points used to create this dashboard:
- How many characters are Dead vs. Alive
- How many Dead vs. Alive in prominent families (such as Baratheon, Lannister)
- Major characters with their total screen time, dead or alive status, and the person’s name who portrayed the character
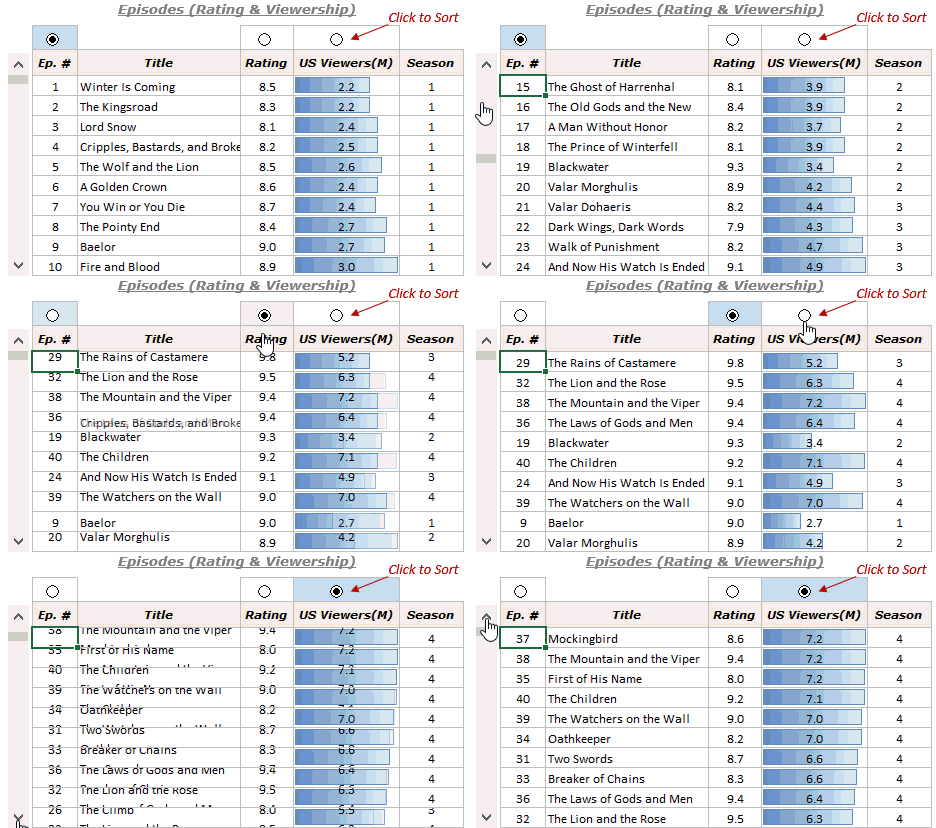
- Episode titles with rating and viewership (and the functionality to sort based on it)
- Character’s Profile – picture, allegiance, and how he/she died (if dead)
What Excel Stuff makes this dashboard?
- Scroll bar to go through the list of characters.
- Radio button to sort the data.
- Check Boxes to show selected data only.
- Picture Look-up technique.
- VBA to get the profile when double-clicking on character’s name.
- Some back-end Excel functions to make it all work.
How to play with this Game of Thrones Dashboard?
- Use check-boxes to get the list of characters with screen time, status, and the name of the person portraying the character (in the selected season(s)).
- Double Click on characters name to get the profile, which shows character’s picture, allegiance, and how the character died (if he/she did).
- Use radio buttons to sort the episode list based on episode number, rating, or viewership.
Go ahead, download this dashboard (~17 MB) and let me know your thoughts, comments, feedback…
Where did the data come from?
This was the hard part. I have used multiple sources to collate the data.
- Screen time – Posted in a forum by a user “Sellsword”.
- Character data and Images – From Game of Thrones Wiki.
- Episode Data – IMDB.
- Images for Dead/Alive – BandCollectables website.
Want to learn how to make this dashboard?
If you would like to learn how to make this dashboard, let me know in the comments sections. If there is a good response, I am willing to put in the time and effort to create a video tutorial on how to create such a dashboard and share it with you all (for FREE of course)
And remember – Winter is Coming!!!
Note: I have tried my best to ensure that the data is accurate. If you find any errors, do let me know. Also, this dashboard is made with the data available for first the 4 seasons.
UPDATE: I got 120+ requests for the video via comments/mail/social media. So here is the full-length video tutorial on how to create this Game of Thrones dashboard in Excel.
You May Also Like the Following Excel Tutorials:
- Creating a KPI Dashboard in Excel – Part 1 | Part 2 | Part 3.
- Excel Dashboard: Premier League Season 2014-15 visualized.
- Adding a Drop-down List in Excel.
- Creating a Heat Map in Excel.


44 thoughts on “Game of Thrones Dashboard – Visualizations in Excel”
Do you have this up to the current season? Is there a way to download it?
How are the backgrounds in the “US Viewers (m)” column achieved?!?
Conditional formatting… got it! So cool 🙂
This is great thanks, I am wondering if you can link an Excel file with movie names to IMDB site in order to retrieve more information!?
You forgot Arya’s alliance with House of Black & White…
I have used the data till season 4. I believe Arya goes to House of Black & White in season 5
A Lannister always pays his debts :)0 that’s a fantastic piece of work if you produce a tutorial on Dashboards please let me know 🙂
Thanks for commenting John.. I have a series on tutorial (including Game of thrones dashboard tutorial). You can access it here – trumpexcel.com/dashboard-video-series
Hello Mr. Excel, first of all a big big thank to you for starting such a nice and informative forum for all at cost of nothing…there is a lot to learn from your videos. I am into the profession which demands the deep knowledge of excel and VBA. I do create some automations but I need more learnings on how to create such dynamic Scorecards and Dashboards.
Also, if possible please share thoughts on what all things a developer can keep in mind before starting with the creation of scorecards.
Furthermore, I need more exposure/learnings on VBA automations, would be great if you can share some of examples with all.
Again thank you a lot for this.
Regards,
Anil Jangra
Hi Sumit,Its amazing.. curious to know how it has been made.. & looking forward some more dashboard.
Gr8 job
Thanks for stopping by and commenting.. Glad you liked it 🙂 I am working on more dashboard ideas and would soon share it on the blog
Hi, I am not able to use this dashboard. Can you please explain how can we open this dashboard.
Thanks Gaurav
Hi Kumar.. Thanks for stopping by and checking out the dashboard. It has a small macro in it, so you would need to enable content (in a bar that appears when you open the dashboard). When you enable it, you can use the interactive controls (checkboxes and radio buttons), and when you click on the name of the character, its profile/pic appears on the right
Hi Sumit, Thanks for your prompt response. I have downloaded the dashboard but I have not got the excel file (Dashboard) through which I can open the dashboard. Please suggest how can we get it.
What are you getting when you click on the download button? You should get an excel file (~17 MB). When you open that excel file, you would see the dashboard in one of the tabs.
I got a ZIP file “Game+of+Thrones+Dashboard_Final”. When extracted, I got some xml files and folders “docProps, xl, _rels”. No excel file available there.
Please advise.
This is weird. Anyway, try this link to download the file – https://www.dropbox.com/s/m9scsohh7aqw0hy/Game%2Bof%2BThrones%2BDashboard_Final.xlsm?dl=0
Awesome Job Sumit! I am a huge Game of Thrones fan! I would like to learn how to do a dashboard like this! Please make a video and share.
Thanks for commenting Caroline.. Glad you like the dashboard.. Will soon create the video and share it 🙂
Hi Sumit
Please do share the steps to create this dashboard.
Thanks for stopping by and commenting.. will share the video soon 🙂
I’m always looking for ways to improve my Excel skills. Looking forward to the dashboard training.
Thanks for stopping by and commenting 🙂
This is awesome…please share the video.
Thanks for commenting Gayathri.. I will create the video and share in a couple of weeks 🙂
I can’t wait for you to share the video on how you created this dashboard! Talk about an impressive presentation! I have always thought I was fairly good with Excel until I saw this. Now I feel like i am in Excel pre-school!
Thanks for commenting Shana.. I have got enough responses to get started on the video. I will soon share the video on how to make this dashboard. Glad you liked the dashboard 🙂
This proves that excel is not for dummies! This is amazing.
Thanks for stopping by and commenting Victor. Glad you liked it 🙂
Thanks for sharing. I should confess that I don’t know anything about ‘Game of Thrones’. 🙂 But it is interesting to me from the point of Excel usage.
I have tried to stay away from form controls as my previous experiences have not been great. It didn’t work the same way in different Excel versions. The scroll bar would just not stop scrolling. etc. 🙂 But after seeing your implementation, I want to try to use them again. I will do so in my next template.
Thanks again.
Thanks for commenting.. I know what you are talking about scroll bars. Sometimes it goes out of control and keeps moving. This happens when the recalculation time is higher due to heavy calculations in the dashboard. I try and remove array/volatile formulas and use helper columns to avoid these. But this is one issue that I have also faced multiple times
I would love to know how to make this dashboard.
Never seen Game of Thrones but I love the concept of the dashboard.
Thanks for commenting.. Glad you liked it 🙂
Very cool Sumit, I like it alot! You don’t realize how much death is in this show until you crunch the numbers 🙂
Glad you like it Chris.. number crunching for GoT was fun. I got to read about so many characters
Amazing – Would like to know how to create it!!
Thanks for commenting Nishant.. Would create a video and share how I made it 🙂
Dis Dashboard takes pssion for GOT to new hights.
Thanks for commenting.. glad you liked it 🙂
Dashboard for GOT! This is so much fun! Brushing up the last four seasons. Awesome Sumit!
Thanks for commenting Charu.. I got a refresher on all the seasons while creating this dashboard 😀
This is so amazing!! really loved the way its depicted 🙂 great way of learning with characters of GOT!! PS: dead/ alive pic is the best!!
Great work Sumit – look forward to more dashboards!!
Thanks for commenting Mehar.. Glad you liked it 🙂