I was never into sports. I tried my hands at a number of sports, but I was always below average in most of it (you got to give me some credit for trying at least).
In 2010, my roommate got me addicted to watching football. We would keenly follow all the matches in English Premier League and La Liga.
I even played fantasy football with a couple of football junkies. I still follow these matches and I still suck at playing it. 🙂
But I am better at making dashboards, and in this tutorial, I will show you how to create an Excel Dashboard that analyses English Premier League games of the 2014-2015 season.
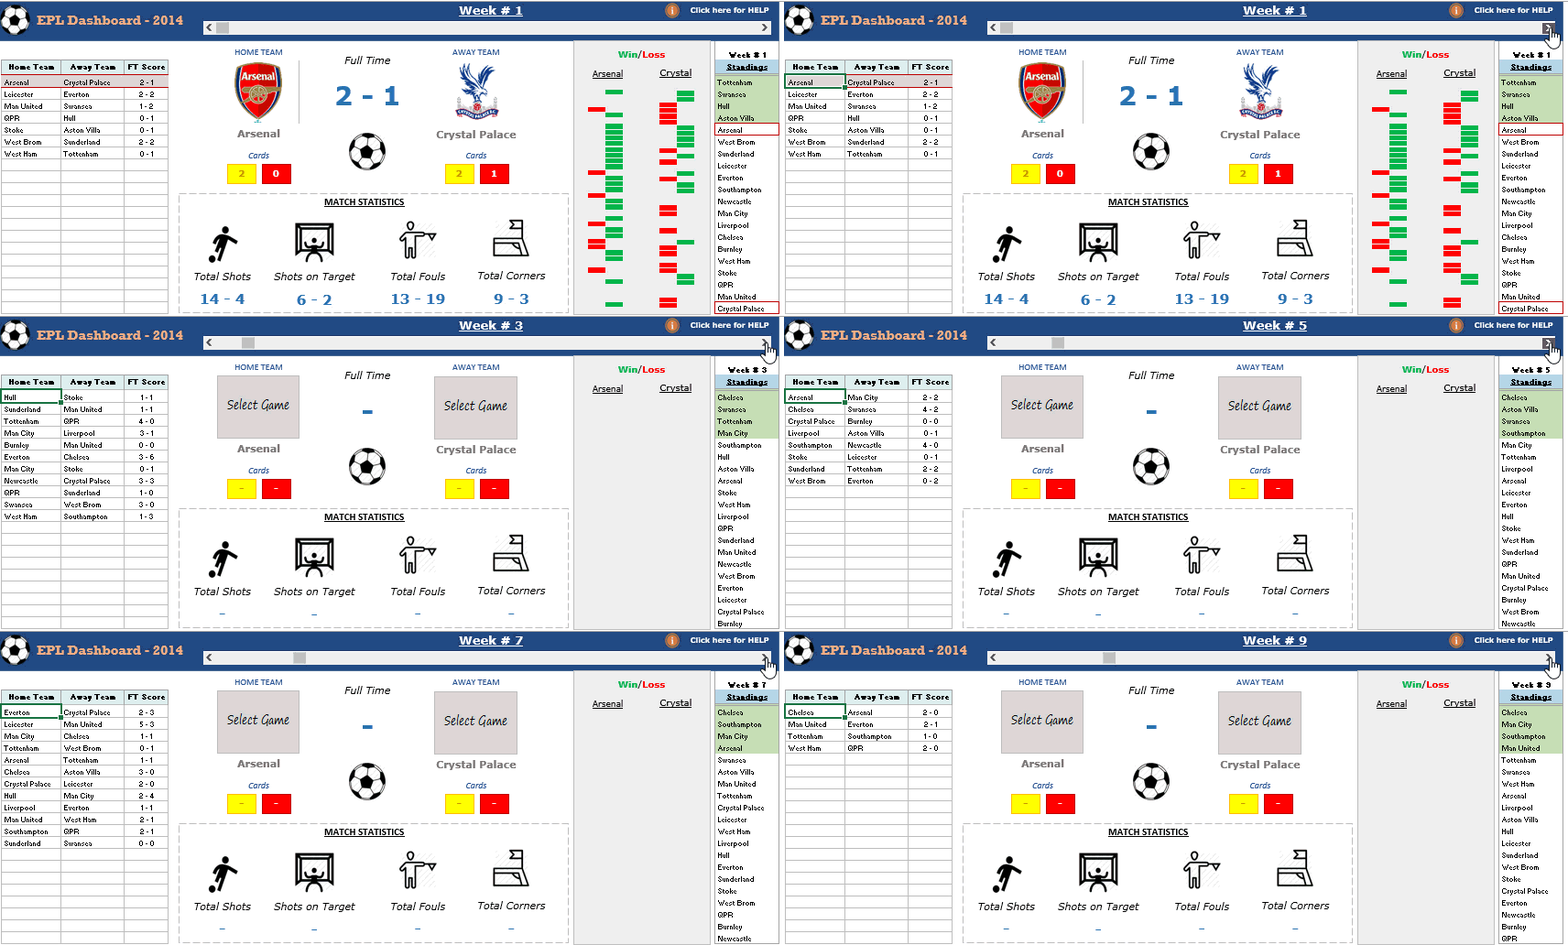
Here is how the final dashboard looks like:
Excel Dashboard – EPL Season 2014-15 Visualized
How to use this Excel Dashboard:
- Use Scroll bar to change the week number.
- Note that as you change the week number, it shows the games played it that selected week and the ranking of the teams at the end of the week.
- Note that as you change the week number, it shows the games played it that selected week and the ranking of the teams at the end of the week.
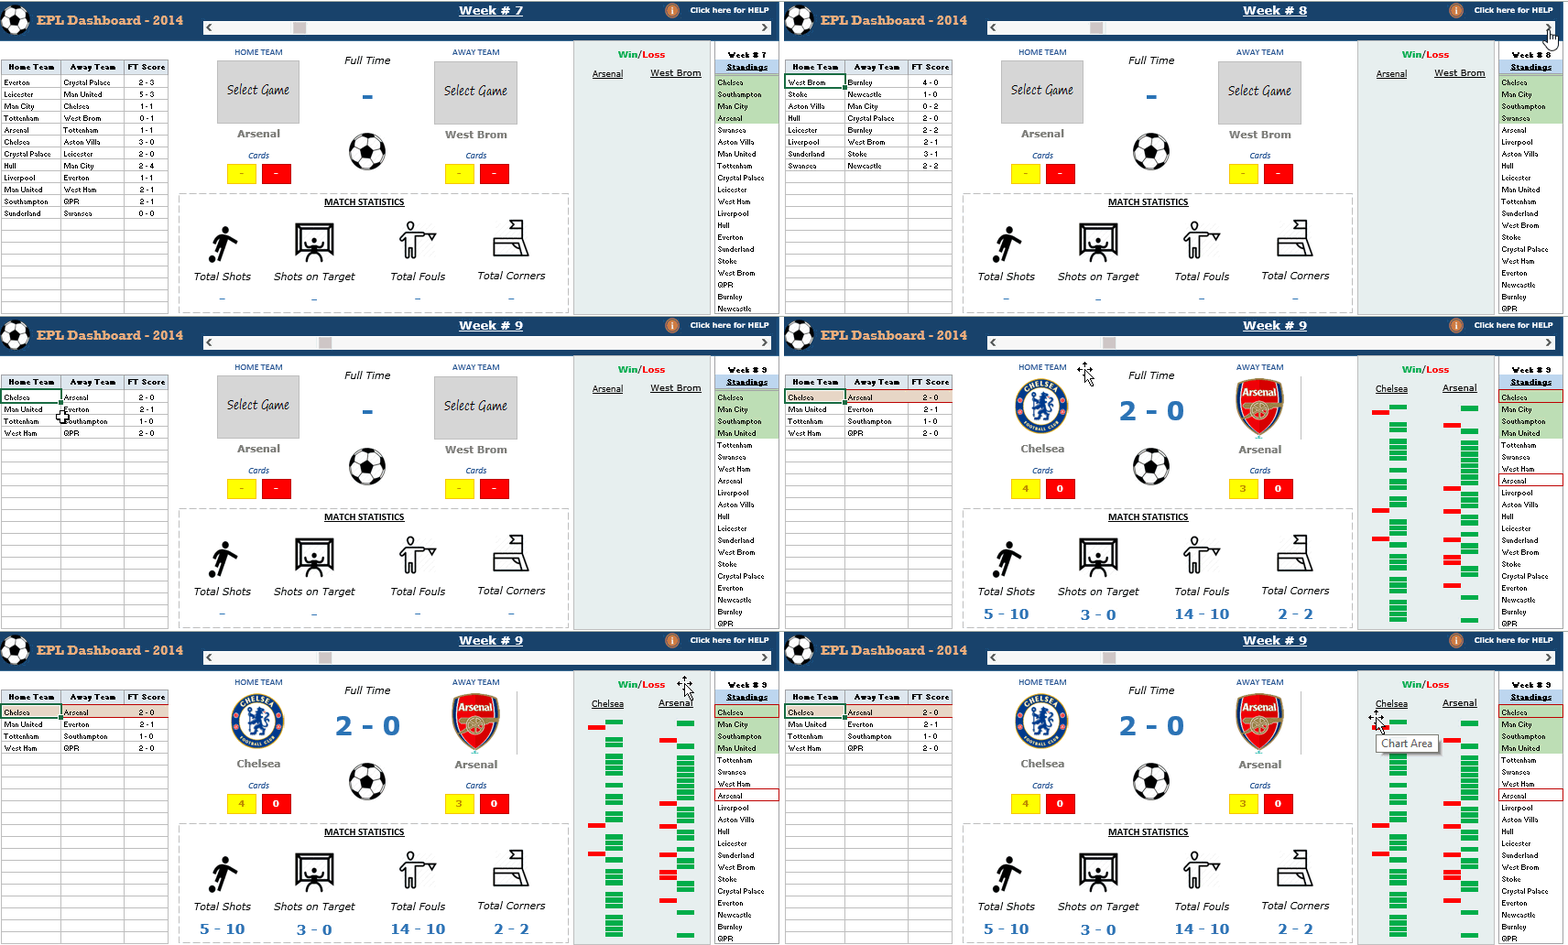
- Double click on the game result cells to get the detail for the game.
- As soon as you double click on the cells that have the game results, the match statistics update along with the logo of the clubs. It also shows the total win/loss numbers of both the teams for the entire season. For example, if I double-click on a game of Chelsea, it would show only 3 lost games for Chelsea (in the red color bar in the win/loss chart).
- As soon as you double click on the cells that have the game results, the match statistics update along with the logo of the clubs. It also shows the total win/loss numbers of both the teams for the entire season. For example, if I double-click on a game of Chelsea, it would show only 3 lost games for Chelsea (in the red color bar in the win/loss chart).
- Click on the help icon to show instructions. Click on it again to hide the instructions.
Download the Premier League Excel Dashboard
Learn to Create World-Class Dashboards in Excel. Join the Excel Dashboard Course.
Where did the data come from?
- I got all the data from www.football-data.co.uk. It has similar data for other leagues and competitions.
- I got the logos from Wikipedia.
What all goes into making this dashboard?
- Scroll bar to change week number.
- Excel Functions – INDEX | MATCH | SUMPRODUCT | ROWS | IFERROR
- Excel Table and structured references (a must for data-driven dashboards).
- Named Ranges (this dashboard uses Picture Lookup technique to display the relevant icon on user selection).
- A little bit of VBA.
Are you a football fan too? Do you like it? Let me know your thoughts by leaving a comment.
Download the Premier League Excel Dashboard
Other Excel Dashboard Tutorials:
- A Guide to Creating an Excel Dashboard.
- KPI Dashboard in Excel – Part 1 | Part 2 | Part 3.
- Game of Thrones Dashboard.
Learn to create Killer Excel Dashboards
If you want to learn to create world-class Excel Dashboard, consider joining our Dashboard Course. Click here to know more about the course.


15 thoughts on “Excel Dashboard: Premier League Season 2014-15 Visualized”
Dear Sumit. Congratulations with this wonderful example of creating a visual beautiful dashboard. Could you tell how the displayed “Loss/Win chart” could be changed into “Win/Loss chart” (= just as title in dashboard specifies)? I believe somehow data isn´t displayed correctly. Thanks for claryfying.
Would love to download this but I’ve tried on a couple of PC’s and it takes me to a page of ‘code’
Can i have the excel file? after download from the link, it appears garbled message.
Ha, yes. Me too.
Hey i like your work its informative and very visual also i do love to learn as much as i can from you. but i have a couple of ideas and models i have been using in soccer prediction and if you don’t mind can we discuss that?
How easy is it possible to set this for 24 teams / 46 games??
Hi Sumit, excellent job! Looks great. The scroll bar is an inspired choice for navigating through the season. Out of curiosity, what part did you use the VBA for?
Thanks for dropping by Ben.. Glad you like the dashboard. I used VBA for 2 things:
1. Update game stats when you double click on the game (from the list on the left)
2. Show/Hide help when you click on the orange icon on the top right
give a person a fish and he eats today, teach them to fish and they can feed themselves
i thought it would take forever to discover your “magic”
a little time and “like a blind man i picked up my hammer and saw”
i will have to find time for your Dashboard course when i retire in at year-end
the “magic” is simple and teachable
Thanks for commenting Gary.. Glad you like the dashboard.. This skill is easy to acquire. All you need is the right set of nuts and bolts (or hammer and saw if you prefer that)
This makes my head hurt thinking of the possibilities.
I have futbol die-hard friends and they are having kittens over this.
Amazing.. Very innovative. I really like the way it shows the instructions for help.. Would love to see player level data in this as well
Thanks for commenting Ajay.. Glad you liked it.. I looked for player level data, but couldn’t find a compiled data set anywhere
This is awesome! Thanks for sharing Sumit.. Love it
Thanks for commenting John.. Glad you liked it 🙂