

The ODDLYIELD function in Excel gives you the yield of a bond whose last coupon period is shorter or longer than its regular ones. This happens when a bond’s maturity date doesn’t line up with its normal coupon schedule.
ODDLYIELD is for when you buy the bond during that last, irregular period. By then the bond has only one payment left (the final coupon plus the redemption amount), and the YIELD function, which assumes a regular coupon schedule, gets it slightly wrong.
Below, I start with a single bond and then a whole list of bonds. After that, I show how ODDLYIELD calculates its result, how it compares with YIELD, and how to find the price for a target yield.
Follow along with the example file
ODDLYIELD Function Examples.xlsx
ODDLYIELD Function Syntax
Here is the syntax of the ODDLYIELD function:
=ODDLYIELD(settlement,maturity,last_interest,rate,pr,redemption,frequency,[basis])
- settlement – the date you buy the bond (not the date it was first issued).
- maturity – the date the bond matures and pays back its face value.
- last_interest – the bond’s last coupon date before maturity. Since you’re buying the bond in its final period, this is the most recent coupon it has paid.
- rate – the bond’s annual coupon rate, such as 4.25%.
- pr – the price you pay per $100 of face value, without the interest that has built up since the last coupon.
- redemption – the amount the bond pays back at maturity per $100 of face value. For most bonds, this is 100.
- frequency – the number of coupon payments per year. Use 1 for annual, 2 for semiannual, and 4 for quarterly.
- [basis] – optional. The day count method, which sets how Excel counts the days between dates: 0 (US 30/360, which treats every month as 30 days), 1 (actual/actual), 2 (actual/360), 3 (actual/365), or 4 (European 30/360). If you leave it out, Excel uses 0.
The three dates must be in order: the last coupon date first, then the settlement date, then the maturity date. If the settlement date is on or before the last coupon date, or on or after the maturity date, ODDLYIELD returns the #NUM! error.
You don’t need to tell ODDLYIELD whether the last period is short or long. It works that out from the last_interest and maturity dates, so the same formula handles both.
A frequency other than 1, 2, or 4 (like 12 for monthly payments) returns the #NUM! error. So does a basis outside 0 to 4.
The dates should be real dates in cells, or dates built with the DATE function. If Excel can’t read a date, ODDLYIELD returns the #VALUE! error.
The ODDLYIELD function works in Excel 365, 2024, 2021, 2019, 2016, and Excel for Mac.
When to Use the ODDLYIELD Function
Use this function when you need to:
- Find the yield of a bond in its final period when that period isn’t a regular length
- Compare the yields of several short-dated bonds that mature off their coupon schedule
- Check what return you’d get at the price a seller is quoting
- Work out the highest price you can pay for a bond to get a target yield
Let me show you a few practical examples of how to use the ODDLYIELD function.
Example 1: Calculate Bond Yield With a Short Last Period
Let’s start with a single bond.
This bond pays a coupon every six months and paid its last one on August 15, 2026. But it matures on January 15, 2027, only five months later, so its last period is shorter than usual.
Below are the details of the bond, and I want to get its yield in cell B10.
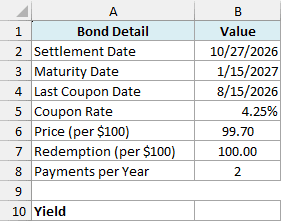
Here is the formula:
=ODDLYIELD(B2,B3,B4,B5,B6,B7,B8)
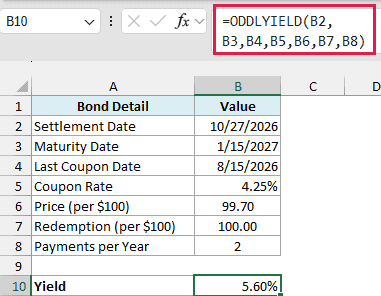
The formula returns 5.60%, which is higher than the bond’s 4.25% coupon.
That’s because the quoted price (99.70) is 0.30 below the 100 the bond pays back at maturity. That gain comes in less than three months, so it adds up once it’s turned into an annual rate.
ODDLYIELD returns a decimal (0.0560). If you see that instead of a percentage, format the cell as a percentage with two decimal places.
Important: Enter the price without the interest built up since the last coupon (the clean price, which is how bond prices are usually quoted). If you enter the full 100.55 you pay, which includes 0.85 of that interest, ODDLYIELD returns 1.69% instead of 5.60%.
Example 2: ODDLYIELD for a List of Bonds (One Formula)
Now let’s get the yield for a whole list of bonds at once.
Below is a list of ten bonds that are all in their last coupon period, and I want the yield of each bond in column F, using the settlement date, redemption, and payments per year in I2:I4.
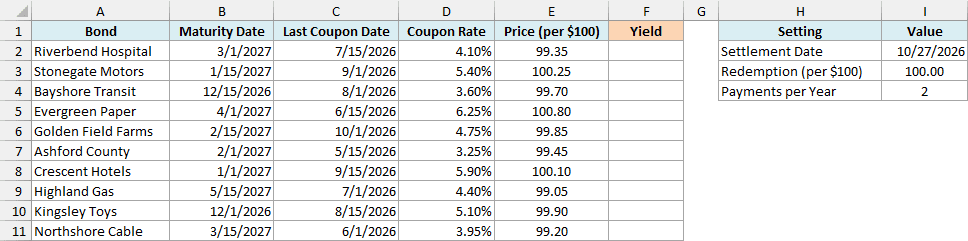
Here is the formula:
=ODDLYIELD(I2,+B2:B11,+C2:C11,+D2:D11,+E2:E11,I3,I4)
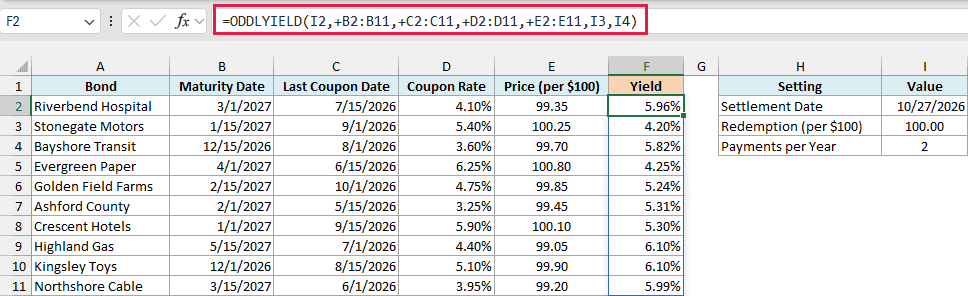
This one formula spills all ten yields into F2:F11. Each bond uses its own maturity date, last coupon date, coupon rate, and price, while the values in I2:I4 apply to every bond.
The plus sign (+) in front of each range is what makes this work.
ODDLYIELD can’t take a range of cells directly, but the plus sign turns each range into a plain list of values, and ODDLYIELD returns one result for each bond, using the values from that bond’s row.
It’s the same fix that works for other Excel functions that won’t spill, such as the EOMONTH and EDATE functions.
Important: Without the plus signs, ODDLYIELD returns a single #VALUE! error instead of spilling. Put + in front of every range you pass to it, because leaving it off even one range breaks the results.
Some of these bonds have a short last period (Kingsley Toys has only three and a half months between its last coupon and maturity). Others have a long one (Highland Gas has ten and a half months), and the same formula handles both.
Stonegate Motors, Evergreen Paper, and Crescent Hotels cost more than 100, so their yields (4.20%, 4.25%, and 5.30%) are lower than their coupons. The bonds priced below 100 all yield more than their coupons.
If you are using Excel 2019 or earlier, enter the below formula in cell F2 and then copy it down the range:
=ODDLYIELD($I$2,B2,C2,D2,E2,$I$3,$I$4)
Example 3: How ODDLYIELD Calculates the Yield
Here’s a quick way to see what ODDLYIELD is actually measuring.
Since the bond has only one payment left, its yield is simply what you gain as a share of what you pay, turned into an annual rate.
Below is the bond from Example 1 with its ODDLYIELD result in B10, and I want to work out the same yield by hand in cell B11.
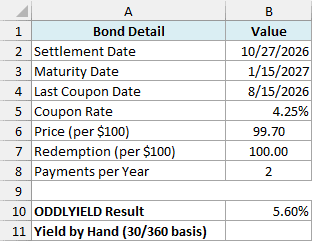
Here is the formula:
=LET(paid,B6+100*B5*DAYS360(B4,B2)/360,received,B7+100*B5*DAYS360(B4,B3)/360,(received-paid)/paid*360/DAYS360(B2,B3))
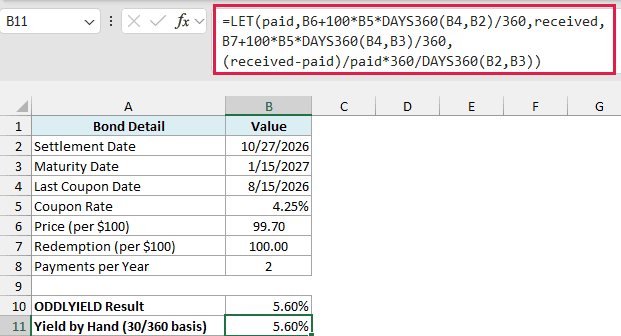
How this formula works:
paidis the price (99.70) plus the interest built up from the last coupon to the settlement date (0.85). That’s the 100.55 you actually hand over.receivedis the redemption (100) plus the final coupon, which covers the whole period from August 15 to January 15 (1.77). So you get back 101.77.(received-paid)/paidis your gain as a share of what you paid, which is about 1.21%.360/DAYS360(B2,B3)turns that into an annual rate, based on the 78 days you hold the bond. The 30/360 basis counts every month as 30 days, so that’s 78 days rather than the 80 calendar days.
Both cells show 5.60%, so ODDLYIELD is a simple annual return on what you pay. There’s no compounding, because there’s only one payment to wait for.
This check uses the DAYS360 function, so it only matches ODDLYIELD with the default basis of 0 (US 30/360). It’s a way to understand the result, and ODDLYIELD is still the function to use.
The LET function used here works in Excel 365 and Excel 2021 or later.
Example 4: ODDLYIELD vs YIELD for an Odd Last Period
You might wonder why you can’t just use the YIELD function, so let’s compare the two.
This bond pays a coupon every six months, but its last regular coupon was on July 15, 2026, and it matures on May 15, 2027. That’s ten months, so its last period is longer than usual.
Below are the details of the bond, and I want to compare the ODDLYIELD result in B10 with the YIELD result in B11.
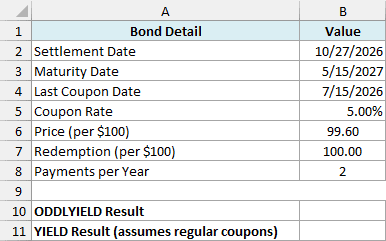
Here is the ODDLYIELD formula:
=ODDLYIELD(B2,B3,B4,B5,B6,B7,B8)
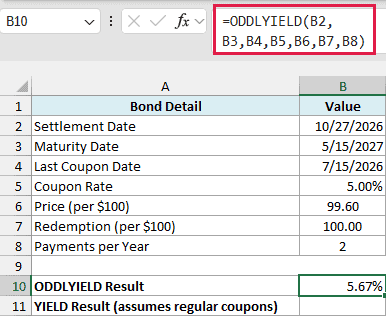
It returns 5.67%. ODDLYIELD knows the last coupon date, so it counts the built-up interest from July 15 and treats the ten-month final coupon as the one payment left.
And here is the YIELD formula:
=YIELD(B2,B3,B5,B6,B7,B8)
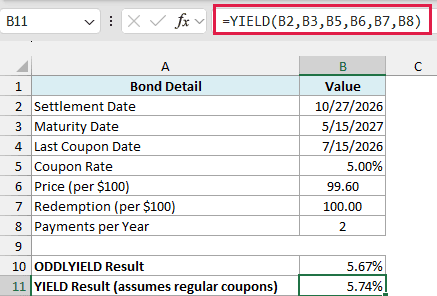
YIELD returns 5.74%. It has no last coupon date argument, so it assumes the bond pays every six months counting back from maturity, which means a coupon on November 15, 2026, that this bond never pays.
The gap is small here (0.07 percentage points), but it comes from a payment schedule the bond doesn’t have. So for a bond in an odd last period, ODDLYIELD is the one to trust.
Example 5: Find the Highest Price for a Target Yield
Let’s step it up with the reverse question: how much can you pay for a bond and still get the yield you want?
This bond pays a coupon every quarter, and its last period runs from September 15, 2026, to February 1, 2027. That’s longer than a regular three-month period.
Below are the details of the bond with a target yield of 6% in B8, and I want the highest price I can pay in B10, and then a check of that price with ODDLYIELD in B11.
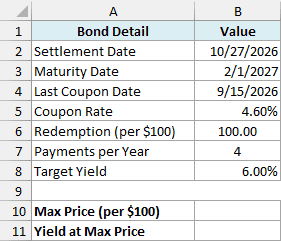
Here is the formula for the highest price:
=ODDLPRICE(B2,B3,B4,B5,B8,B6,B7)
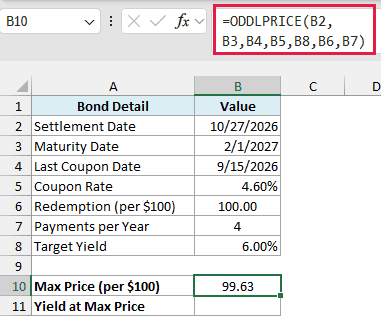
The ODDLPRICE function is the reverse of ODDLYIELD. It takes the same arguments, except that the yield goes where the price would be, and it returns the price per $100.
Here it returns 99.63. If you pay 99.63 or less for this bond, you get a yield of at least 6%.
And here is the ODDLYIELD formula that checks it:
=ODDLYIELD(B2,B3,B4,B5,B10,B6,B7)
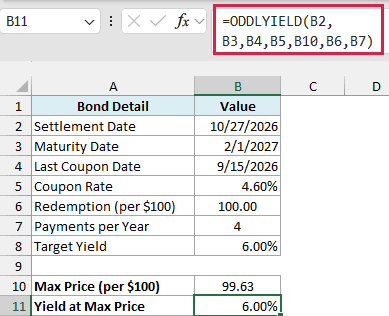
Putting that price back into ODDLYIELD returns exactly 6.00%, which confirms the two functions agree.
The formula points at B10 rather than a typed 99.63. That’s because B10 holds the full unrounded price, and the rounded 99.63 would return 6.01%.
So these are five practical ways to use the ODDLYIELD function in Excel. It gets you the yield of a bond in an odd last period, works across a whole bond list, and pairs with ODDLPRICE for a target yield.
I hope you found this Excel tutorial useful.
Other Excel Articles You May Also Like:
