

The ERF function in Excel calculates the mathematical error function. You’ll come across it in probability calculations and engineering equations.
It measures the area under a particular curve between two points, then multiplies that area by a fixed scaling factor. Mathematically, the curve is e^(-t²), and the scaling factor is 2/√π.
Calculating an area this way is called integration; the two endpoints are the integration limits. Excel handles the calculation once you supply those limits.
Despite the name, ERF doesn’t fix formula errors. That’s a job for the IFERROR function; ERF works with numbers and integration limits.
In this tutorial, I’ll show you how to calculate ERF values, work between two limits, connect the result to normal probabilities, and find an input from a known ERF value.
There’s one Excel quirk to watch for: passing a range straight to ERF can return an error. The examples use a leading + where needed so one formula can return the whole column of results.
Follow along with the example file
ERF Function Examples.xlsx
ERF Function Syntax
Here is the syntax of the ERF function:
=ERF(lower_limit, [upper_limit])
- lower_limit is required. With two arguments, it is the starting point of the integration. With only one argument, it is the endpoint, and the integration starts at zero.
- upper_limit is optional. Supply it when you want to set both endpoints yourself.
So, with one argument, Excel calculates from zero to your number. With two arguments, it calculates from the first number to the second.
To leave out upper_limit, leave out the comma as well. A trailing comma supplies an empty argument instead of omitting it and can return #N/A.
ERF is available in Excel for Microsoft 365, 2024, 2021, 2019, and 2016, including supported Mac editions. The spilling examples below use dynamic-array Excel, such as Microsoft 365, 2024, or 2021; single-cell alternatives are included for older versions.
When to Use the ERF Function
Use the ERF function when you need to:
- Evaluate the error function in a mathematical or engineering formula.
- Calculate the scaled area under e^(-t²) between two specified limits.
- Explore the connection between the error function and probabilities around the mean of a normal distribution.
- Check an input calculated from a target error-function value.
The workbook has one sheet for each example, named Example 1 through Example 4. Let’s start with the single-argument form.
Example 1: Calculate ERF for Several Inputs
The single-argument form is a good place to see how positive and negative inputs behave.
Below is a list of input values, and I want to calculate the error-function value for each one in column B.
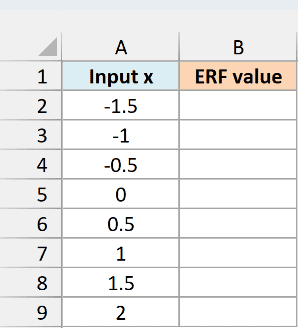
Enter this formula in cell B2 and press Enter:
=ERF(+A2:A9)
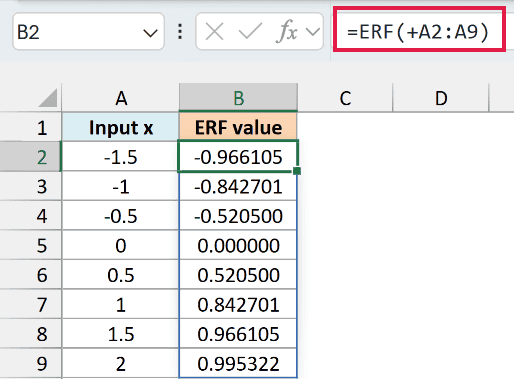
The formula returns eight results, spilling from B2 to B9. For the input 1, it returns approximately 0.842701; for -1, it returns approximately -0.842701.
Because we supplied only one argument, each result measures the scaled integral from zero to that input. Negative inputs reverse the direction, so the answer is negative; an input of zero returns zero.
The + before A2:A9 tells Excel to pass the range’s values as an array. It doesn’t change their signs or add anything to them.
Important: Keep the leading + in this range-based formula. ERF can return #VALUE! when given the range reference directly, even in dynamic-array Excel.
Make sure B2:B9 is clear before entering the formula. If an existing value blocks the output, Excel returns #SPILL!; clear the blocking cell and enter the formula only in B2.
The workbook shows six decimal places, but the cells retain their more precise calculated values.
A word such as “missing” in an input cell gives #VALUE!, so replace that text with the intended number before calculating.
If you are using Excel 2019 or earlier, enter the below formula in B2 and copy it down to B9:
=ERF(A2)
Example 2: Calculate ERF Between Two Limits
Now let’s supply both limits so the integration doesn’t have to start at zero.
Below are pairs of lower and upper limits, and I want to calculate each ERF interval in column C.
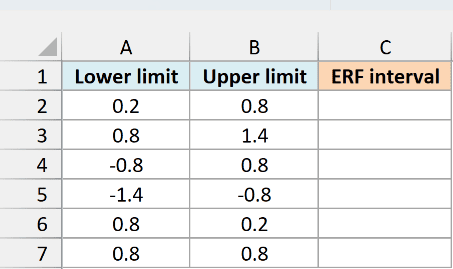
Enter this formula in C2:
=ERF(+A2:A7,+B2:B7)
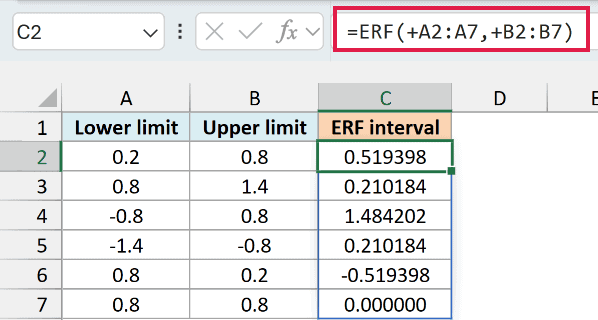
Excel matches the limits row by row and spills the six answers into C2:C7. The first row integrates from 0.2 to 0.8 and returns approximately 0.519398.
Both arguments use + because both are range references. Each lower limit in column A pairs with the upper limit on the same row in column B.
Notice the reversed limits in row 6. Going from 0.8 back to 0.2 returns approximately -0.519398, the negative of the first result.
Equal limits give zero, as you can see in row 7. There’s no interval to integrate when the start and end are the same.
The interval from -0.8 to 0.8 returns approximately 1.484202. That’s valid: the two-limit ERF result is a scaled integral, so you shouldn’t interpret every result as a probability or percentage.
For Excel 2019 or earlier, enter the below formula in C2 and copy it down to C7:
=ERF(A2,B2)
Example 3: Find a Central Normal Probability
ERF also helps explain a familiar result from the normal distribution: about 68% of values fall within one standard deviation of the mean.
Here, k is the distance from the mean measured in standard deviations, abbreviated SD. A distance of 1 means the interval runs from one standard deviation below the mean to one standard deviation above it.
Below are several distances from the mean, and I want the normal probability within each symmetric interval in column B.
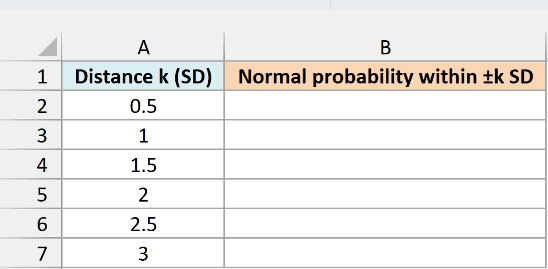
Enter the following formula in B2:
=ERF(A2:A7/SQRT(2))
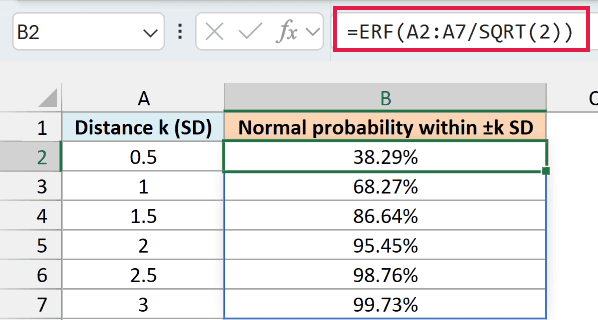
The formula returns 68.27% for one standard deviation and 95.45% for two standard deviations. At three standard deviations, the result is 99.73%.
The SQRT function gives the square root of 2. Dividing each distance by that number converts the standard-normal scale to the scale used by ERF.
The division already turns the range into an array of calculated values, so this formula doesn’t need the leading + used in the previous examples. The results spill down automatically.
Important: These probabilities assume a normal distribution and a nonnegative distance k. They describe the interval from -k to +k standard deviations around the mean, not the probability of being below +k.
This example shows the ERF relationship. For ordinary questions about the probability below a given standard-normal value, the NORM.S.DIST function expresses that task more directly.
If you are using Excel 2019 or earlier, enter the below formula in B2 and copy it down to B7:
=ERF(A2/SQRT(2))
Example 4: Calculate and Check Inverse ERF
Sometimes you know the ERF result and need the input that produced it.
Excel has no built-in ERF.INV function, but you can use the inverse normal distribution to work backward. Applying ERF to that calculated input then checks your answer.
Below are target ERF values, and I want to find the corresponding input x in column B.
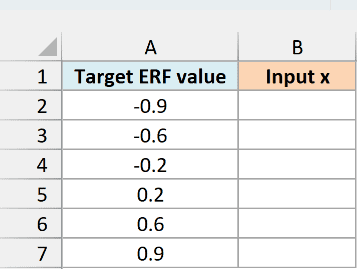
Enter this formula in B2:
=NORM.S.INV((A2:A7+1)/2)/SQRT(2)
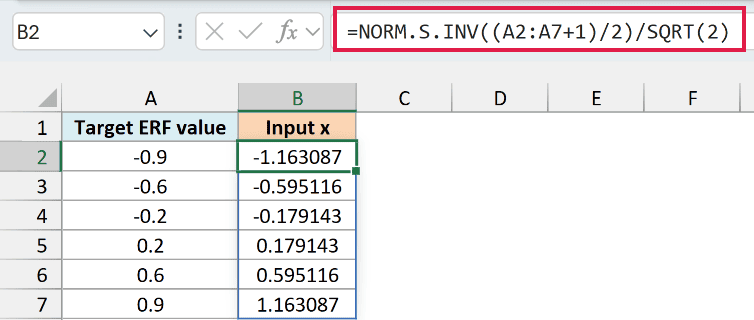
For the target 0.6 in row 6, the formula returns approximately 0.595116. That’s the input whose error-function value is 0.6.
Here is how the formula works:
(A2:A7+1)/2converts each target ERF value into a standard-normal cumulative probability. For 0.6, that probability is 0.8.- The NORM.S.INV function returns the standard-normal value corresponding to that probability.
- Dividing by
SQRT(2)converts that value to the input scale used by ERF.
To check the calculated inputs, enter this formula in C2:
=ERF(+B2:B7)
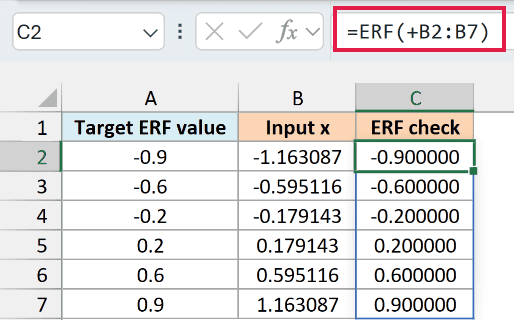
The checks in column C match the targets in column A to the displayed six decimal places. Excel uses the full values stored in column B for this check, not just the rounded numbers you see.
Important: Each target must be greater than -1 and less than 1. At either endpoint, or outside that range, the inverse formula gives #NUM! because the converted probability is outside the range accepted by NORM.S.INV.
If you are using Excel 2019 or earlier, enter the below inverse formula in B2 and copy it down to B7:
=NORM.S.INV((A2+1)/2)/SQRT(2)
Then, in Excel 2019 or earlier, enter the below check formula in C2 and copy it down to C7:
=ERF(B2)
The related ERF.PRECISE function handles the single-limit error function. ERF is useful when you want to supply two limits directly; the ERFC function instead returns the complementary error function, mathematically one minus the single-limit ERF value.
So these are four ways to use ERF, from evaluating inputs to checking an inverse calculation. I hope you found this tutorial helpful.
Other Excel Articles You May Also Like:
