
You can group numbers in Pivot Table to create frequency distribution tables. This helps in analyzing numerical values by grouping it into ranges.
A simple example of this could be to analyze how many students scored marks between 40 and 50 and how many got marks between 50 and 60 and so on..
Another example could be to create a frequency distribution of age of a group of people. This would help in identifying how many people fall in the 30-40 age group and how many in 40-50 age group and so on.
Let’s take an example of retail sales data to see how you can group numbers in Pivot Table in Excel.
Click here to Download the Example File to follow along.
Group Numbers in Pivot Table in Excel
Suppose you have retail sales data as shown below:

Using this data, I’ve created a Pivot Table with Stores and Sales in the Rows area and Sales in the Value area. This will give you a Pivot Table as shown below (tabular form):

Note that the values column has COUNT instead of SUM. This can be made by changing the value field settings of the Sales value to display COUNT (as shown below).
As of now, the Pivot table isn’t of much use as it shows a lot of data. But you can group the sales value for each store and create a frequency distribution.
To do this:
- Select any cells in the row labels that have the sales value.
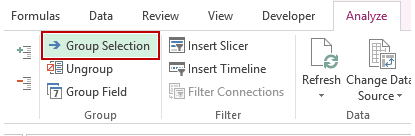
- Go to Analyze –> Group –> Group Selection.
- In the grouping dialog box, specify the Starting at, Ending at, and By values. In this case, By value is 250, which would create groups with an interval of 250.

- Click OK.
This would create a Pivot Table that shows the frequency distribution of the number of sales transactions within the groups that we created.

This Pivot Table now has a frequency distribution that can be used for analysis such as:
- Which stores are doing more high-value transactions?
- Which stores need to improve sales by trying to increase transaction value?
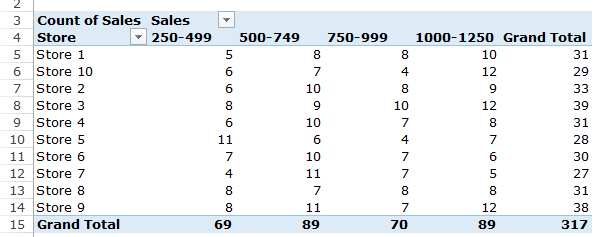
You can also move the grouped sales to the column area to create a matrix that is even easier to read.
Click here to download the example file.
How to Ungroup Numbers in Pivot Table
To ungroup these number groups, select any of the group and go to Analyze –> Group –> Ungroup.

Error While Grouping Numbers in Pivot Table
Sometimes, you may get the ‘Cannot group selection’ error (as shown below) while creating groups with numbers.

This may happen if you have cells that contain text instead of numbers.
In such cases, you need to go back to the data source and remove the text with appropriate numerical value.
Sometimes, numbers are stored as text in Excel. In such case, you need to convert these text to numbers before grouping it in Pivot Table.
You May Also Like the Following Pivot Table Tutorials:
- How to Group Dates in Pivot Table in Excel.
- How to Create a Pivot Table in Excel.
- Preparing Source Data For Pivot Table.
- How to Refresh Pivot Table in Excel.
- Using Slicers in Excel Pivot Table – A Beginner’s Guide.
- How to Apply Conditional Formatting in a Pivot Table in Excel.
- How to Add and Use an Excel Pivot Table Calculated Field.
- How to Replace Blank Cells with Zeros in Excel Pivot Tables.
- Pivot Cache in Excel – What Is It and How to Best Use It?
- Count Distinct Values in Pivot Table
- Sort Pivot Table in Excel
- Group Rows in Excel


Perfect – thanks 🙂
Thanks! Very helpful
Hello there:
I am trying to create pivot table/chart for an overtime report. I want to summarize by the workgroup and have the hours fall into a range (0-25), (26-100), (101-200),(201-300),(301-400), (>400). My pie chart will be by the hour range. Also, is there a way to import the data (downloaded from SAP into a .csv file) and automatically populate these graphs and pivot tables?
Interesting