

The ODDFYIELD function in Excel gives you the yield of a bond whose first interest period is shorter or longer than the rest. That’s common with newly issued bonds, because the issue date rarely lines up with the regular coupon schedule.
The regular YIELD function assumes every period is the same length, so it can’t account for that odd first coupon. ODDFYIELD takes the issue date and the first coupon date as well, and works the yield out from the actual payment schedule.
ODDFYIELD works on one bond at a time, and pointing it at a range of cells returns an error. There’s a simple fix for that, which lets one formula handle a whole list of bonds.
Below, I start with one bond that has a short first period and one with a long first period. Then I cover a list of bonds, ODDFYIELD vs YIELD, the switch to YIELD after the first coupon, and a check with ODDFPRICE.
Follow along with the example file
ODDFYIELD Function Examples.xlsx
ODDFYIELD Function Syntax
Here is the syntax of the ODDFYIELD function:
=ODDFYIELD(settlement,maturity,issue,first_coupon,rate,pr,redemption,frequency,[basis])
- settlement – the date you buy the bond.
- maturity – the date the bond matures and pays back its face value.
- issue – the date the bond was issued and started earning interest.
- first_coupon – the date of the bond’s first interest (coupon) payment.
- rate – the bond’s annual coupon rate, such as 4.5%.
- pr – the price you pay per $100 of face value.
- redemption – the amount the bond pays back at maturity per $100 of face value. For most bonds, this is 100.
- frequency – the number of coupon payments per year. Use 1 for annual, 2 for semiannual, and 4 for quarterly.
- [basis] – optional. The day count method, which sets how the days between two dates are counted when working out interest: 0 (US 30/360, which treats every month as 30 days), 1 (actual/actual), 2 (actual/360), 3 (actual/365), or 4 (European 30/360). If you leave it out, Excel uses 0.
The price is per $100 of face value, so a price of 98.75 means you pay 98.75% of what the bond pays back at maturity. This works the same whatever the bond’s actual face value is.
A frequency other than 1, 2, or 4 (like 12 for monthly payments) returns the #NUM! error.
You can leave basis out unless the bond’s terms say it uses a different day count method.
The four dates should be real dates in cells, or dates built with the DATE function. If Excel can’t read one of them as a date, ODDFYIELD returns the #VALUE! error.
The ODDFYIELD function works in Excel 365, 2024, 2021, 2019, 2016, and Excel for Mac.
When to Use the ODDFYIELD Function
Use this function when you need to:
- Find the yield of a new bond whose first coupon comes sooner or later than a regular period
- Compare several newly issued bonds before you buy one
- Track the yield of a bond you hold before its first coupon is paid
- Check a yield against the bond’s price
Let me show you a few practical examples of how to use the ODDFYIELD function.
Example 1: Yield of a Bond With a Short First Coupon
Let’s start with a single new bond.
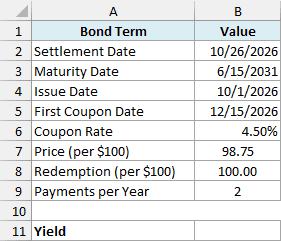
Below are the details of a bond that was issued on 10/1/2026 and pays its first coupon on 12/15/2026, and I want to get its yield in cell B11.
Here is the formula:
=ODDFYIELD(B2,B3,B4,B5,B6,B7,B8,B9)
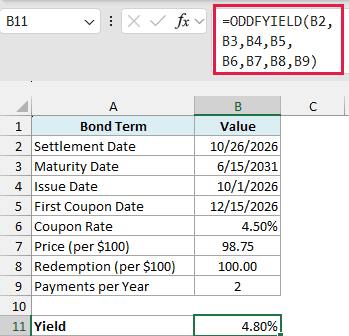
The formula returns 4.80%, which is higher than the bond’s 4.50% coupon. That’s because you pay 98.75 and get 100 back at maturity, so you earn that 1.25 difference on top of the coupons.
This bond pays twice a year, so a regular period is six months. But its first period runs from 10/1/2026 to 12/15/2026, only about two and a half months, which makes it a short first period.
ODDFYIELD uses the issue date and the first coupon date to work out that smaller first payment.
Since I left out the basis argument, it uses the US 30/360 day count. Switching to basis 1 (actual/actual) still gives 4.80% here, so the day count makes very little difference on this bond.
ODDFYIELD returns a decimal (0.0480). If you see that instead of a percentage, format the cell as a percentage with two decimal places.
Important: The dates must go in this order: issue date, settlement date, first coupon date, and then maturity date. If any two are the same or out of order (like a settlement date before the issue date), ODDFYIELD returns the #NUM! error.
Example 2: Yield of a Bond With a Long First Coupon
Now let’s look at the opposite case, where the first period is longer than usual.
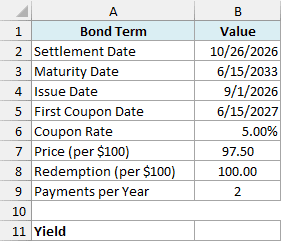
Below are the details of a bond that was issued on 9/1/2026 and pays its first coupon on 6/15/2027, and I want to get its yield in cell B11.
Here is the formula:
=ODDFYIELD(B2,B3,B4,B5,B6,B7,B8,B9)
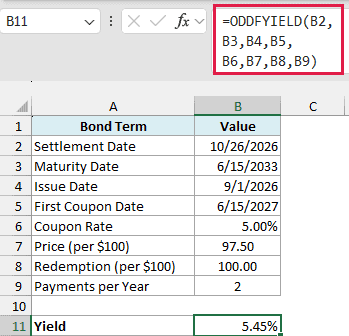
The formula returns 5.45%, which is above the 5% coupon because you pay 97.50 and get 100 back at maturity. It’s the same formula as in Example 1, since ODDFYIELD reads the long first period from the issue and first coupon dates.
The first period here runs from 9/1/2026 to 6/15/2027, which is about nine and a half months. So the first coupon covers more than a regular six-month period and you also wait longer to get it, and ODDFYIELD accounts for both.
Important: The first coupon date must fall on the bond’s regular schedule, counting back from the maturity date. This bond’s coupons fall on June 15 and December 15, so a first coupon date of 6/1/2027 would return the #NUM! error.
Example 3: Compare Yields of Several Bonds With One Formula
Now let’s get the yield for a whole list of new bonds at once.
Below is a list of ten newly issued bonds with their dates, coupon rates, and prices, and I want the yield of each bond in column G, using the settlement date in J2 and the payments per year in J3.
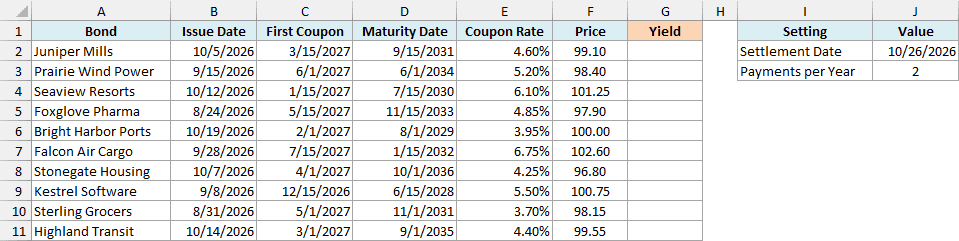
Here is the formula:
=ODDFYIELD(J2,+D2:D11,+B2:B11,+C2:C11,+E2:E11,+F2:F11,100,J3)
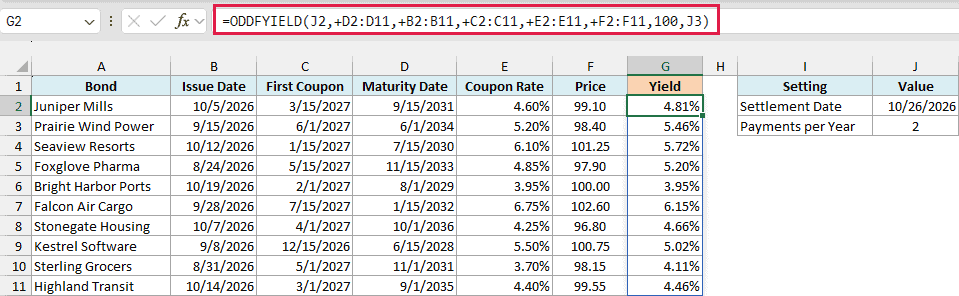
This one formula spills all ten yields into G2:G11. Each bond uses its own dates, coupon rate, and price, while the settlement date in J2, the redemption of 100, and the payments per year in J3 apply to every bond.
Notice that the ranges are not in column order. ODDFYIELD wants the maturity date before the issue date, so the maturity dates in D2:D11 go first, followed by the issue dates in B2:B11 and the first coupon dates in C2:C11.
The plus sign (+) in front of each range is what makes the formula spill. ODDFYIELD can’t take a range of cells, but the plus sign turns each range into a plain list of values, and ODDFYIELD then returns one result for each value.
The same trick works for other Excel functions that won’t spill, like EOMONTH and EDATE.
Important: If you give ODDFYIELD plain ranges like D2:D11 without the plus sign, it returns a single #VALUE! error instead of spilling. So put + in front of every range you pass to it.
The results also show why the coupon rate alone doesn’t tell you much. Bright Harbor Ports costs exactly 100, so its yield matches its 3.95% coupon.
Falcon Air Cargo costs 102.60, so its yield (6.15%) is lower than its 6.75% coupon. Sterling Grocers costs 98.15, so it yields 4.11% even though its coupon is only 3.70%.
If you are using Excel 2019 or earlier, enter the below formula in cell G2 and then copy it down the range:
=ODDFYIELD($J$2,D2,B2,C2,E2,F2,100,$J$3)
Example 4: ODDFYIELD vs YIELD for a Long First Coupon
You might wonder why you can’t just use the YIELD function for these bonds, so let’s compare the two.
Below are the details of a bond bought at exactly 100 with a long first period, and I want to compare the ODDFYIELD result in B11 with the YIELD result in B12.
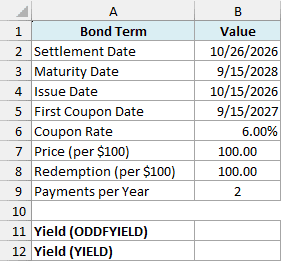
Here is the ODDFYIELD formula:
=ODDFYIELD(B2,B3,B4,B5,B6,B7,B8,B9)
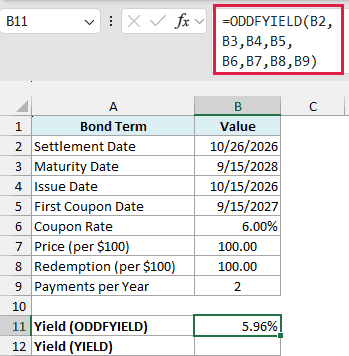
This returns 5.96%, a bit lower than the bond’s 6.00% coupon, even though you’re paying exactly 100.
And here is the YIELD formula for the same bond:
=YIELD(B2,B3,B6,B7,B8,B9)
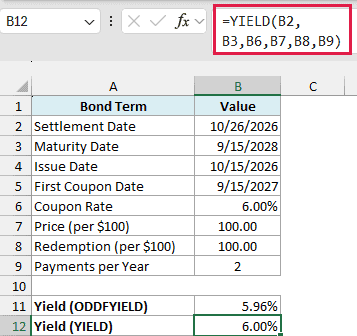
YIELD returns 6.00%. It has no arguments for the issue date or the first coupon date, so it assumes the coupons come every six months, counting back from the 9/15/2028 maturity date.
That means YIELD expects a coupon on 3/15/2027. But this bond was issued on 10/15/2026 and doesn’t pay its first coupon until 9/15/2027, eleven months later.
Since you wait longer for that first payment, the real yield is a little lower, and that’s the 5.96% from ODDFYIELD. The gap is small here, but YIELD is working out the yield for a payment schedule this bond doesn’t have.
Example 5: Switch to YIELD After the First Coupon Is Paid
Here’s a problem you’ll run into if you keep tracking a bond after you buy it.
ODDFYIELD only works while the settlement date is before the first coupon date. Once the first coupon is paid, every remaining period is a regular one, so YIELD is the right function from that point on.
Below are the prices of one bond on ten different trade dates, and I want the yield on each date in column C, using the bond details in F2:F6.
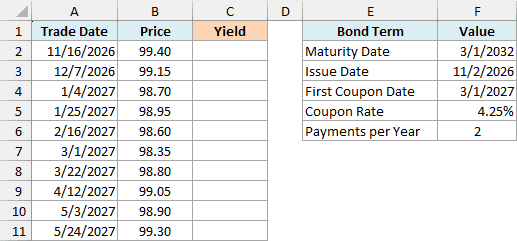
Here is the formula:
=IF(A2:A11<F4,ODDFYIELD(+A2:A11,F2,F3,F4,F5,+B2:B11,100,F6),YIELD(+A2:A11,F2,F5,+B2:B11,100,F6))
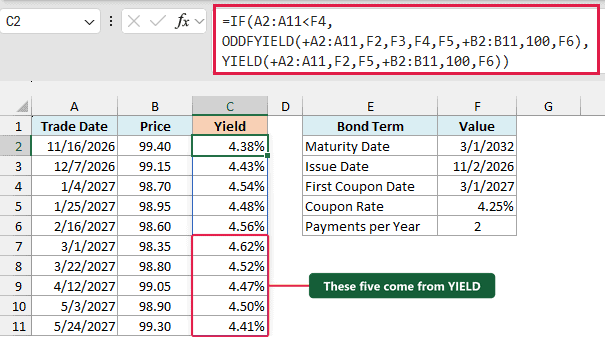
How this formula works:
- A2:A11<F4 checks whether each trade date is before the first coupon date of 3/1/2027.
- For the trade dates before 3/1/2027, ODDFYIELD works out the yield, using each trade date as the settlement date and each price in column B.
- For 3/1/2027 and later, YIELD works out the yield instead. It doesn’t need the issue date or the first coupon date, since the bond is now on its regular schedule.
So the first five yields come from ODDFYIELD and the last five from YIELD. With ODDFYIELD alone, those last five rows would show the #NUM! error.
You could wrap ODDFYIELD in IFERROR and fall back to YIELD instead. But that would also switch to YIELD on a real mistake, like a first coupon date that’s off the schedule, and you’d never see the error.
If you are using Excel 2019 or earlier, enter the below formula in cell C2 and then copy it down the range:
=IF(A2<$F$4,ODDFYIELD(A2,$F$2,$F$3,$F$4,$F$5,B2,100,$F$6),YIELD(A2,$F$2,$F$5,B2,100,$F$6))
Example 6: Check the Yield With ODDFPRICE
Let’s finish with a quick way to check a yield.
The ODDFPRICE function does the reverse of ODDFYIELD. You give it a yield and it returns the price, so plugging the yield back in should give you the price you started with.
Below are the details of a bond that pays interest four times a year, and I want its yield in B11 and the price that yield gives back in B12.
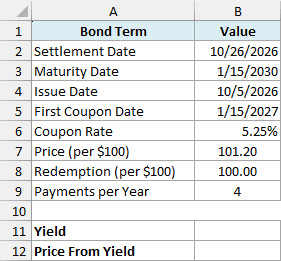
Here is the formula for the yield:
=ODDFYIELD(B2,B3,B4,B5,B6,B7,B8,B9)
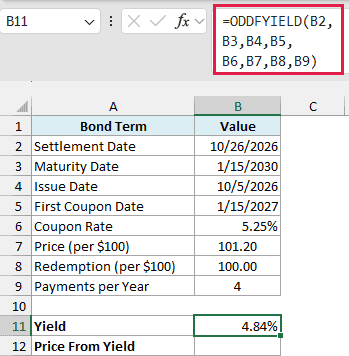
This returns 4.84%. The bond costs 101.20, which is more than the 100 you get back, so the yield is lower than its 5.25% coupon.
This bond pays quarterly, so the frequency in B9 is 4. Counting back from the 1/15/2030 maturity, its coupons fall on January 15, April 15, July 15, and October 15, so the first coupon date of 1/15/2027 is on the schedule.
And here is the ODDFPRICE formula that turns the yield back into a price:
=ODDFPRICE(B2,B3,B4,B5,B6,B11,B8,B9)
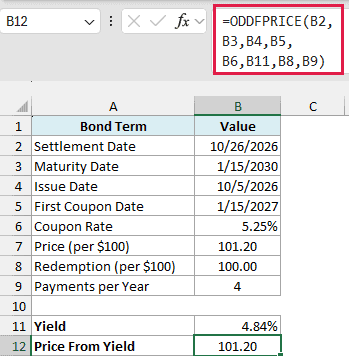
It takes the same arguments as ODDFYIELD, except that the yield in B11 goes where the price was. It returns 101.20, the same as the price in B7, so the yield checks out.
This works because Excel finds the ODDFYIELD result by trial and error. It keeps trying yields in the ODDFPRICE calculation until the price matches the one you gave it.
So these are six practical ways to use the ODDFYIELD function in Excel. It handles bonds with a short or long first period, works through a whole list of bonds with one formula, and hands over to YIELD once the first coupon is paid.
I hope you found this Excel tutorial useful.
Other Excel Articles You May Also Like:
