Excel Dashboards can be very useful when you need to assess the performance of some key metrics over a period of time.
This Call Center Performance Dashboard enables the user to analyze the performance on a weekly basis and track key call center metrics.
Call Center Performance Dashboard
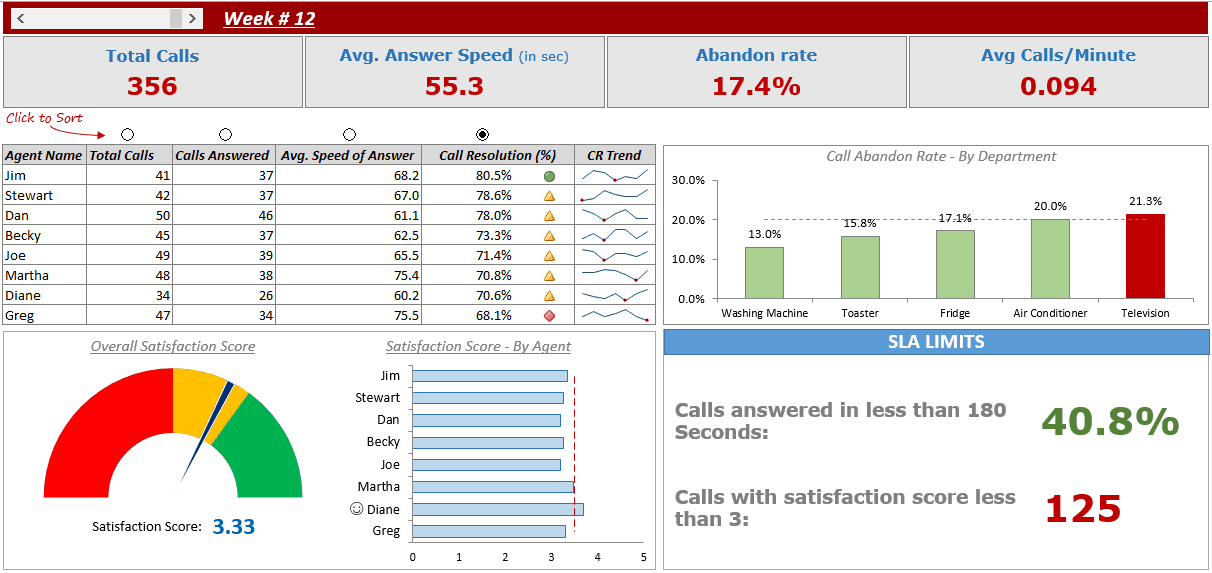
Here’s a how the dashboard looks:
Click here to download the Call Center Performance Dashboard
Here are the metrics that you can track using this dashboard:
- Call center level data: This includes total call, average answer speed, abandon rate, average calls/minute, overall satisfaction score (chart), SLA limits.
- Agent level data: This includes total calls, calls answered, average answer speed, call resolution (%), and call resolution trend.
- Department level data: Call abandon rate by departments.
Note that Week #1 starts from 4 January 2016 in this dashboard as that is when you get the complete data for a week (and is a proper comparison with other weeks).
Here is how this dashboard works:
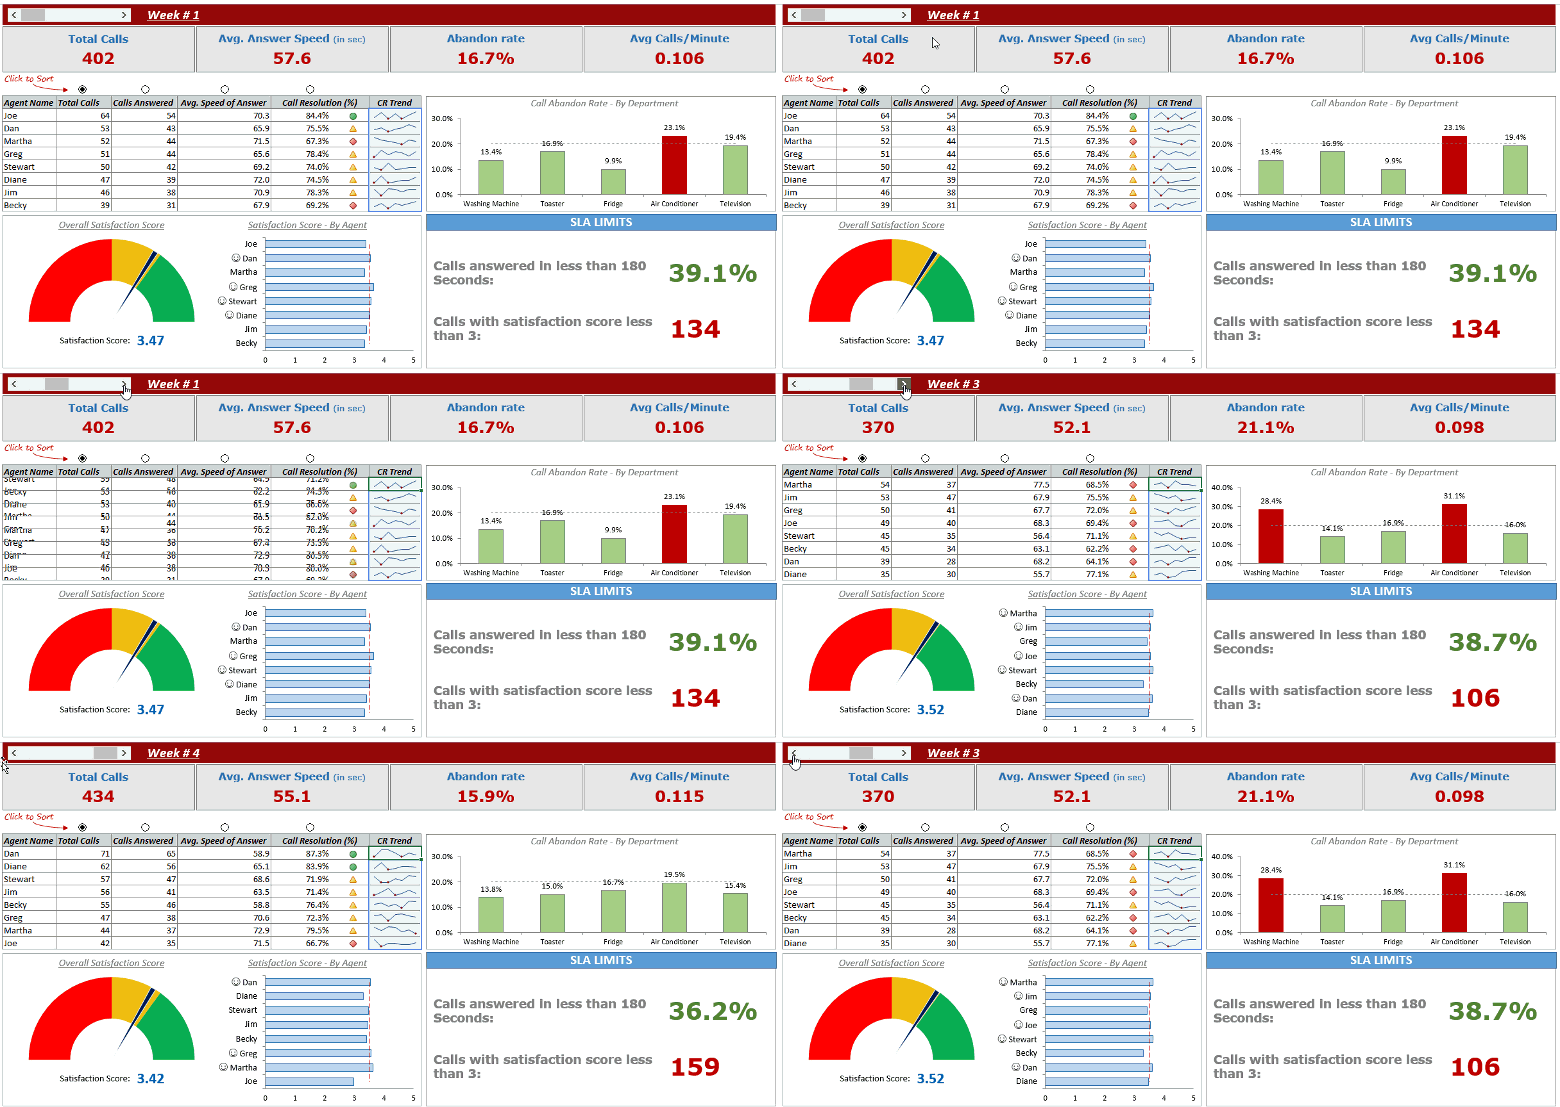
- You can analyze weekly data by using the scroll bar to change weeks. When you change the week, the entire dashboard gets updated with data for that week.
- You also have the ability to sort metrics data by agents (by selecting the radio button). When you select a radio button, the entire data for agents gets sorted in a descending order for that selected metric. The bar chart also updates and sorts the names based on the selection.
Note: This dashboard uses a lot of formulas and as a result, when you change the scroll bar value, you may see it running to the end. It especially happens if you’re using a slow machine. This is due to a lot of calculations that happen in the backend. A workaround is to click on the scroll bar tip and then remove the cursor from it.
When you download this dashboard, you get access to everything (nothing is locked) and you can learn some cool things that make this dashboard, such as:
- Using the Scroll bar to change weeks.
- Using Radio Buttons to sort data.
- Using the SUMPRODUCT function to perform calculations based on user selection.
- Speedometer chart to show the overall satisfaction score for the selected week.
- Sparklines to show call resolution trend for each agent.
- Bar chart to show satisfaction score for agents. Notice a small smiley appears when the agent’s score is more than 3.5
This dashboard is a part of my Excel Dashboard Course but I decided to give it away to everyone for free.
Let me know your thoughts/feedback in the comments section.
Other Excel Dashboard Tutorials:
- A 3 part KPI Dashboard Series: Part 1 | Part 2 | Part 3
- Premier League Season 2014-15 Visualized in an Excel Dashboard
- Game of Thrones Dashboard in Excel.


41 thoughts on “Call Center Performance Dashboard in Excel [FREE Download]”
Hi Sumit, you are doing very great Job, Thank you so much for all the efforts.
I have a question, From where I can get the data like this for practice?
Same question sir
Please let us know. From where do you get the data from the column Satisfaction rating? And Avg speed
Need your help to understand the rating formal in the dashboard
Hi You have been doing such an amazing work. Can you tell me how can I convert this excel in to a Google sheet?
Amazing! How did this illustrations move?
Merci
Damn Good!
good
want e mail check related dashboard
nice
Hi, I am having trouble downloading your dashboard…I keep getting error that it needs to be repaired!
I have some doubts. From where do you get the data from the column Satisfaction rating?
Hi, I was wondering how to link the scroll bar with the changing of data according to weeks?
hello sumit
bolki
mhnjew
thanks alot my brother it helped me
alot
Great!!!!!
How to start another week? example: 10/10/17
As soon as I improve my English I will want your course.
Greetings from the Brazilian friend 😉
HI Sumit,
I need your help, can I have your e-mail address please?
Regards,
Pulkit
Hi there. Great Dashboard however how I have miodified it while learning to create a Dashboard a bit and need it to be by day and not week with the scroll bar. Can you tell me how to change that?
Mate , you are genius…
Great dashboard, thank you brother
Great! One day I learn. Thanks.
Glad you liked it!
bol ki
bol ki
@sumitbansal23:disqus would you be willing to assist me with creating a dashboard for my call center team? My email is lmacdonald@idle0095.com
Hello Sumith.. even i am looking for same kind of dashboard for my team.. i workd as team leads for inbound call center… can you help me out with creating one wish easy adn accurate looking dashboard…
My id: sundeepdasnayak@gmail.com
please contac me
hi Sumit,
I am new in here but thanks a lot for your impressive dash boards. Very dynamic and intuitive I must say. Looking forward to have the dash board course soon.
Please is it possible to come up with an election results dash board? Say Presidential and Parlementary election results. Thus, something more like the call center performance dash board.
Thank you
Thanks for commenting Errol! It can definitely be made. Do you have a data set that I can have a look at? Then I can try and create one if possible
That will great. Please how do I get the data set to you.
You can share the link (if any), or share the data via dropbox or onedrive
https://www.dropbox.com/s/5vqr8yiq30j1rl8/Regional%20Summaries%20Presidential.xlsx?dl=0
Hello Sumit,
I trust you are doing great. Please have you had a chance to check on the link.
Thanks
Great dashboard, thank you Sumit
Thanks for commenting Hossein.. Glad you liked it 🙂
Sumit, impressive work. keep it up bro.
Thanks for commenting Kamal.. Glad you liked it 🙂
Great… Thanks Sumit
Thanks for commenting 🙂